How to forecast the revenue?

Businesses forecast revenues to learn how their operations will perform over time. You can run weekly, monthly, quarterly, yearly, and other forecasts using sales predictions and historical data.
Revenue forecasting is crucial in financial forecasting for businesses to make informed decisions and plan for growth effectively.
And if you don’t know how to forecast revenue, we’ll explain methods, formulas, and how to do it with the world’s leading app.
What Is Revenue Forecasting, and Why Is It Important for Your Business?
Forecasts are a major part of business, but what is revenue forecasting? It's computing your business’s revenue over a period of time. For example, you can generate a weekly, quarterly, or monthly revenue forecast to have a general idea of how much money will be flowing into the business at any given time.
Revenue forecasting is important because it allows businesses to plan for growth, allocate resources efficiently, and anticipate potential financial challenges.
While the accuracy of a business's forecast revenues may not be 100%, there are ways to have a very good idea of where your overall revenue will be for a specific period of time.
How to Start Revenue Forecasting?
If you’re just starting as a business trying to forecast revenues for the first time, follow the steps below to get started:
- Step 1. Define Revenue Streams
List all products or services, their pricing, and purchase frequency to ensure accurate tracking of income sources. This forms the basis for income prediction.
- Step 2. Collect Historical Data
Analyze past sales trends or use industry benchmarks if your business is new. Historical data is vital for reliable income prediction.
- Step 3. Choose a Forecasting Method
Select a method, such as straight-line forecasting for consistent growth or time series analysis for seasonal variations, to project future revenue.
- Step 4. Factor in External Influences
Incorporate market trends, economic conditions, and competitive dynamics to refine your revenue forecast.
- Step 5. Use Tools and Review Regularly
Leverage financial forecasting software for real-time data and automation. Regularly compare forecasts with actual performance to improve accuracy.
The Best Revenue Forecasting Methods
If you want to forecast sales revenue, you’ll find many methods to choose from. Some models are simple to understand and calculate, but they’re often less accurate than other options. Typically, the more intricate the method of forecasting is, the more accurate it will be.
Here are some revenue forecasting methods designed to suit various business needs:
1. Straight Line Forecast Method
The straight-line forecast method is very easy to use and is meant for non-accountants that want to have a general idea of how their revenue will look at a certain point in time.
However, you’ll need historical growth data for this model or a way to determine what growth may look like.
In fact, it’s the same method we used in the above example.
You simply:
- Find your growth rate
- Multiply the rate over the desired period of time
However, the straight-line forecast method doesn’t account for things like seasonal ups and downs or rapid product sales.
2. Moving Average Forecast Method
A moving average forecast accounts for more of the growth patterns over time. Generating forecast revenues using this method is best for short periods of time, such as:
- Weeks
- Months
- Quarters
What makes this method different is that it accounts for upward and downward trends. You may have an average growth of 1% per week in January before a dip in sales in February and so on.
The idea behind the moving average method is that sales are never linear, so they’ll go up and down during the year. You may experience a massive increase in sales for the first two months of the year due to product releases during this time and then experience flat growth in March.
3. Time Series Forecast Method
You can forecast revenues using the time series model, which does a few things:
- Looks at historical data
- Identifies revenue trends
- Estimates of which trends will happen again
However, there is a time and place to use the time series method. For example, the method to forecast revenues is only very accurate when your performance is steady and follows external trends.
During peak seasons, when sales skyrocket and drop quickly, this method may be a valuable tool for forecasting revenues.
4. Linear Regression Forecast Method
The linear regression forecast method shows a relationship between multiple points on a graph. Oftentimes, businesses will use this method to forecast revenues when they’re using Excel. You might create a correlation in your forecast revenues between:
- Sales growth
- Profit growth
- Revenue growth
5. Pipeline Forecast Method
This method uses sales pipelines to project revenue from ongoing deals, making it ideal for income prediction in B2B sales and improving cash flow projections.
6. Exponential Smoothing Method
Exponential smoothing weighs recent data more heavily than older data, making it ideal for rapidly changing markets. This method adapts to sudden shifts, such as market disruptions or product launches.
7. Scenario-Based Forecasting
Scenario-based forecasting allows businesses to create multiple revenue projections based on different assumptions, such as best-case, worst-case, and likely-case scenarios.
This method is particularly helpful for how to do revenue projections during uncertain times or when launching new products.
8. Opportunity Stage Forecasting
This method evaluates revenue potential at various stages of the sales funnel. By analyzing the likelihood of closing deals at each stage, businesses can produce dynamic forecasts that align with their sales process.
Revenue Forecasting Formula
Professionals will use a revenue forecasting formula to help them determine their revenue over a period of time. However, one thing to consider is that sales forecasts are rarely accurate. Manual forecasts are slowly being replaced by two main things:
- Machine learning (ML)
- Artificial intelligence (AI)
When a business has big data sets, ML and AI can work to help spot trends and generate a more accurate revenue forecast model, providing better insights into key financial metrics and how to predict revenue effectively.
How Often Should the Revenue Forecast Be Updated?
It's up to you. Often, businesses will generate forecasts for investors, in business planning or during quarterly meetings. For a long time, all of the calculations were manual and required a lot of resources to produce. However, with modern computing power, it’s now possible to run forecasts in almost real-time, improving cash flow management and aligning financial statements with business goals.
How to Forecast Revenue Accurately?
If you want to forecast revenues accurately, you need to use the data that you have available and also consider external factors. For example, if you have a large business that has been selling the same products or services for a decade, you can reflect back on this data to forecast revenues more precisely.
New businesses do not have this level of luxury.
Startups often have to create forecasts for investors or to secure financing. However, some experts recommend that at this stage in a business, it’s best to focus on expenses and maintain a LEAN operation that will minimize outflows.
A few tips that can help any business for how to do revenue forecasting more accurately are:
- Gather all of your past sales data to help look through historical sales and how they may have fluctuated
- Use software and tools to reduce errors in your revenue forecasting techniques.
- Utilize multiple forecast methods to better understand potential revenue
- Regularly schedule forecasts to have a better understanding of the process
- Analyze how off you were in past forecasts to judge your own accuracy
- Use multiple sets of data and try eliminating the data that may be biased, especially when using external factors to forecast revenues
- Learn about deviations and refine your methods to account for these deviations
By refining your revenue growth strategies over time, you’ll slowly make sense of how your revenue goes through ebbs and flows.
Predict Revenues With The Cash Flow Frog App
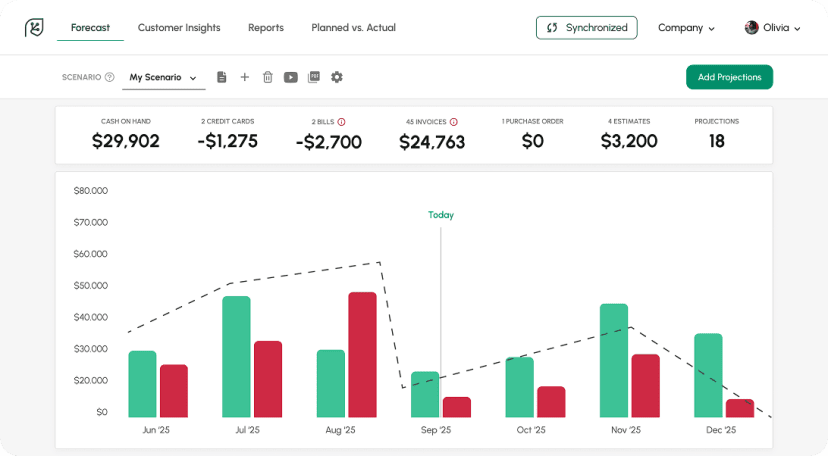
Forecast revenues do not need to be complicated. You don’t need to run a manual revenue forecast report, thanks to Cash Flow Frog.
With Cash Flow Frog, you can:
- Create cash flow forecasts
- See your future bank balance
- Simplify profit and loss management
- Sync data 24/7 with Xero and QuickBooks
- So much more
With the power to forecast revenues, you can be confident in the decisions fueling your business. Project what your revenue will be, know when the right time is to hire new employees and learn when you might need to secure financing to keep operations going smoothly.
New: Setting threshold
Read more

5 Key Financial Metrics Every Business Owner Should Track
Read more
What Is Profitability Analysis and How to Do It?
Read more

Best QuickBooks Online apps
Read more
How To Calculate Adjusted EBITDA and Why Is It So Important?
Read more

Best cash flow forecasting software
Read more
Trusted by thousands of business owners
Start Free Trial Now