Cash Flow Graphs Every Business Should Use
Cash flow data plays a crucial role in decision-making. But for stakeholders and leaders, it can be challenging to visualize this data and make sense of it. Our brains process visuals 60,000 times faster than text, so incorporating a cash flow graph into your reports can provide an accurate picture of the company’s cash position at a glance.
But which graphs should you be incorporating into your reports? Why do cash flow graphs even matter? Let’s look at the importance of cash flow management and how to get started with graphs.
Understanding the Importance of Cash Flow Management
Cash flow management plays an integral role in your business's success. If you’re not managing your cash properly, you may find yourself unable to make ends meet.
The Link Between Cash Flow and Business Success
Why is cash flow so important? Because it’s a measure of your business’s financial health. It tells you how much cash your business is taking in versus how much it’s spending.
- If more money is flowing into your business than out of it, your cash flow will be positive.
- If more money is flowing out of your business than into it, your cash flow will be negative.
When your cash flow is positive, you can be confident that you have enough funds to cover your bills or even have a surplus of cash that you can invest.
Common Cash Flow Challenges Faced by Businesses
Many businesses fail because they run out of cash. Why? Because managing cash flow can be a daunting task.
Some of the most common cash flow challenges businesses face are:
- Not invoicing customers in a timely manner
- Late customer payments
- Not creating and sticking to a budget
- Overlooking expenses
- Low profit margins
- Growing too quickly
Proper cash flow management and incorporating graphs into your reports can help your business overcome these challenges.
Why Cash Flow Graphs Matter
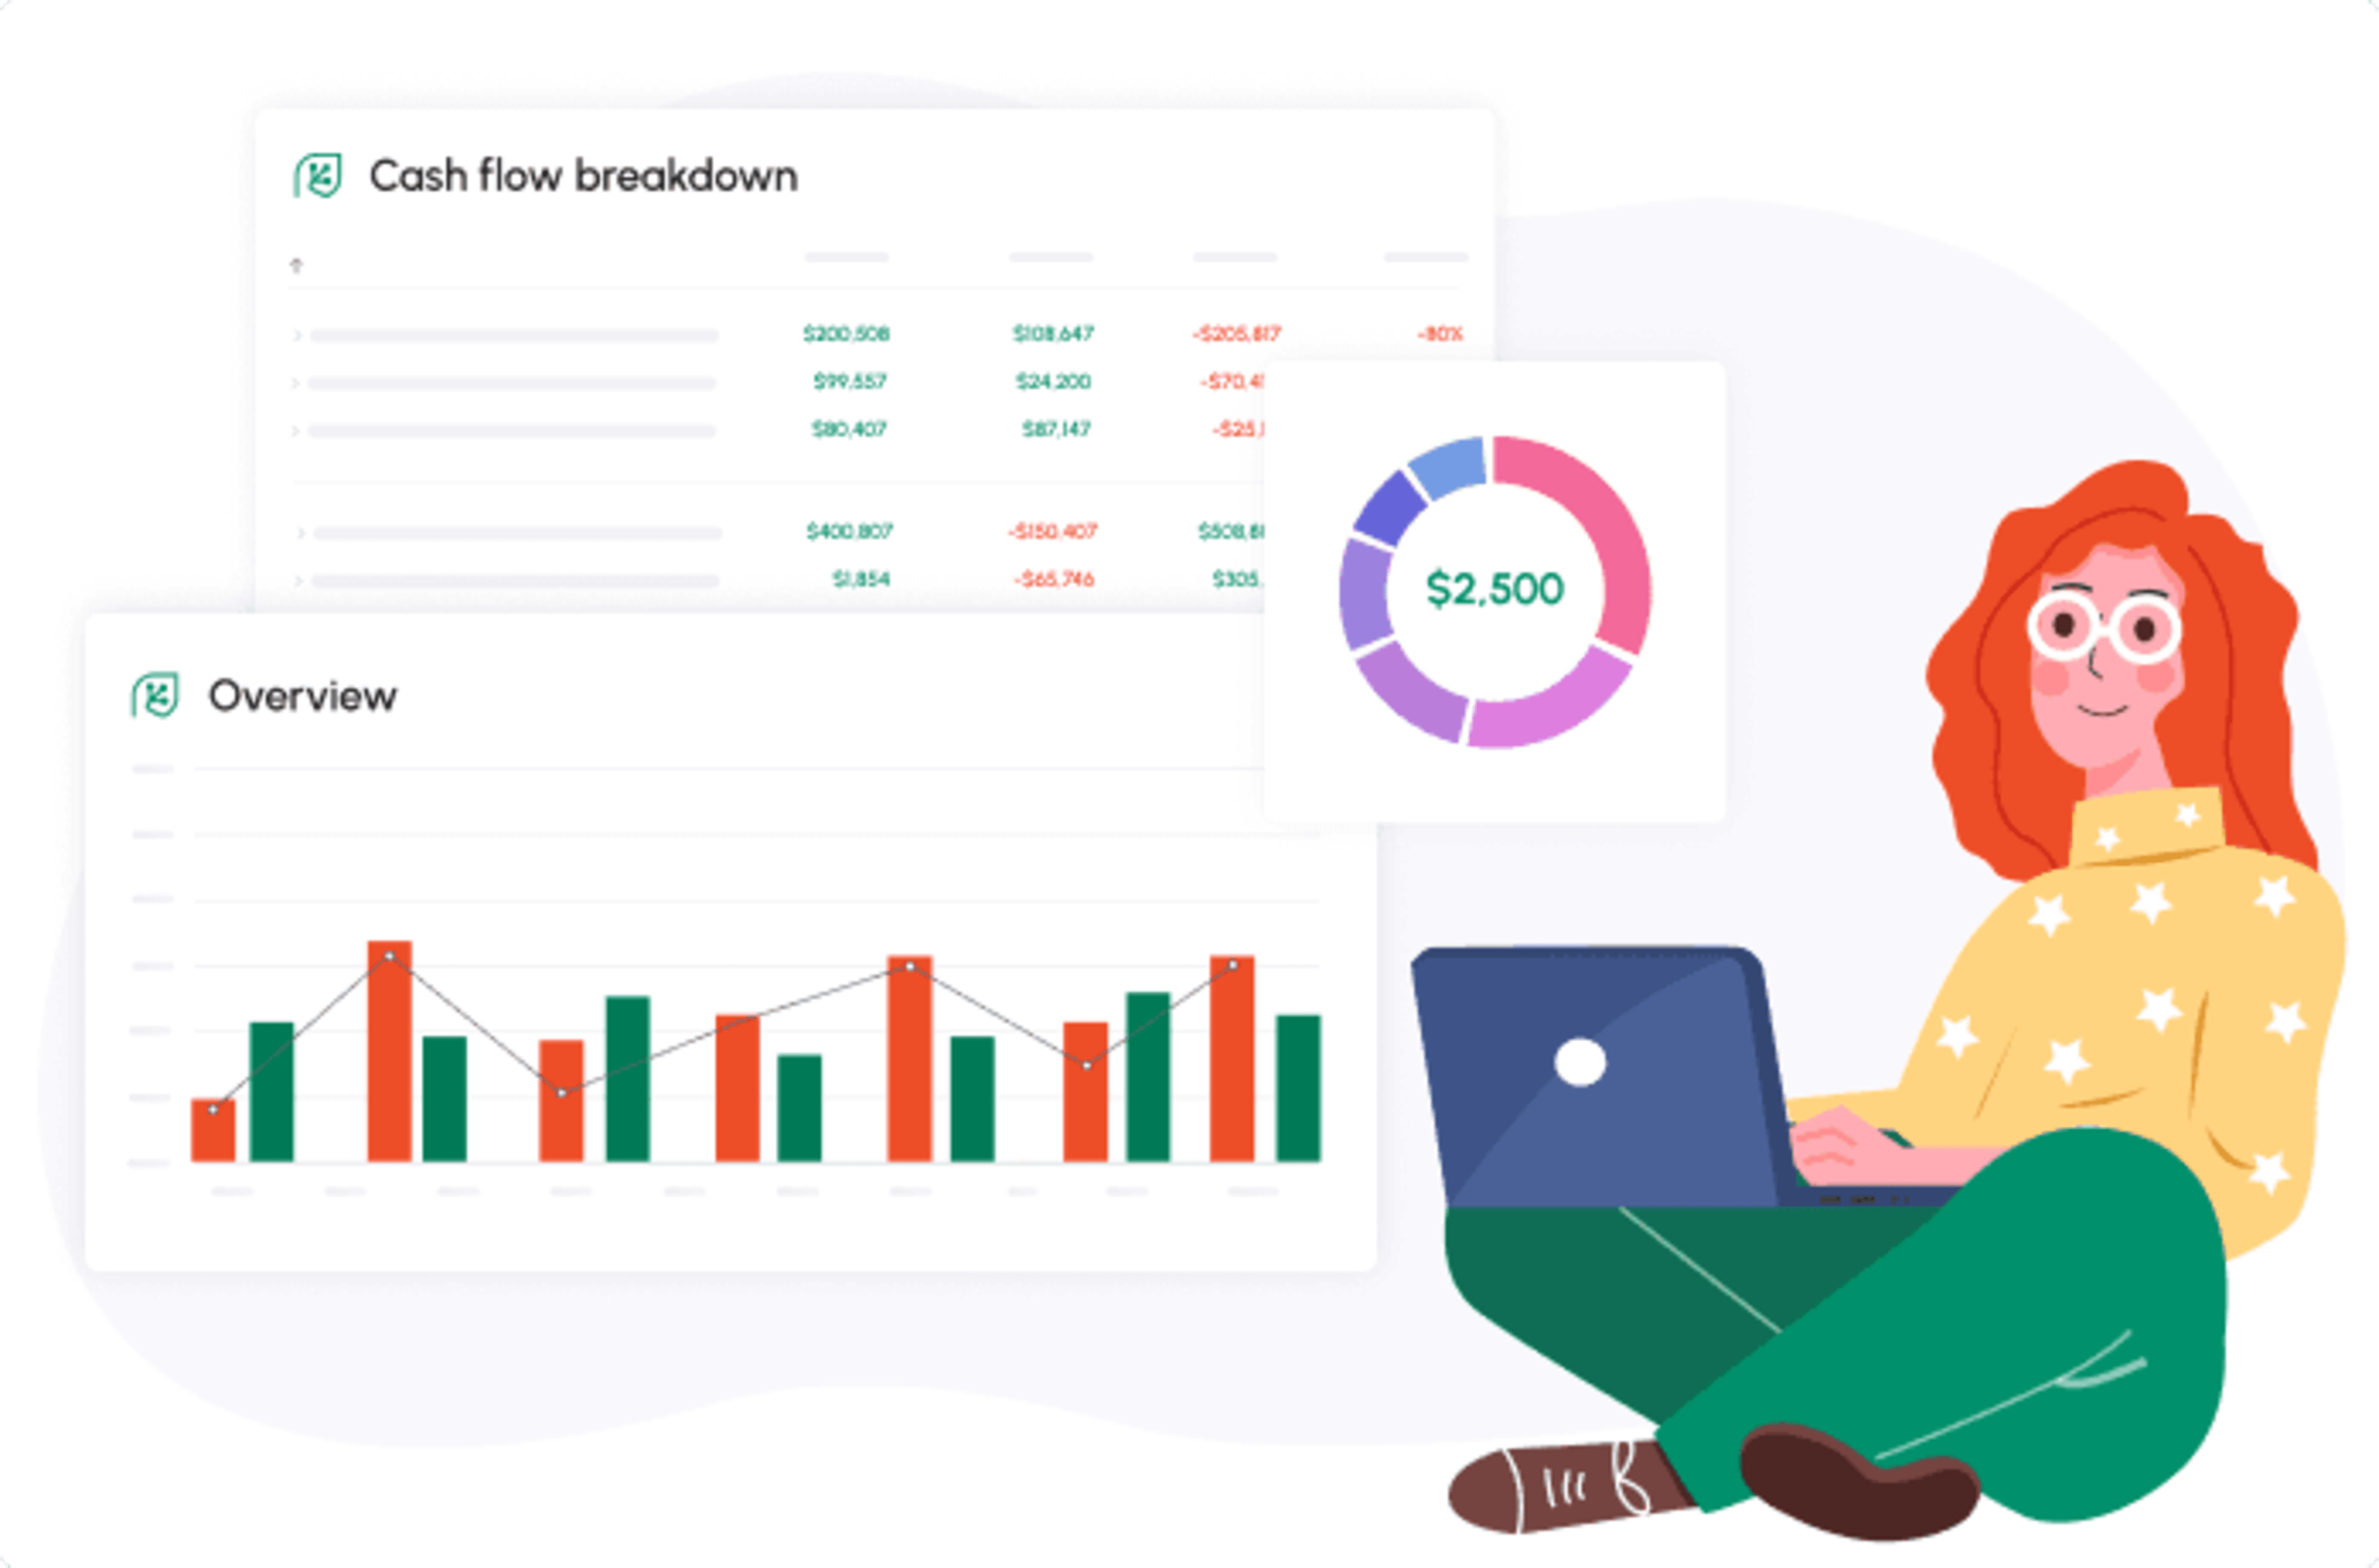
A cash flow graph tells a story. Textual data can also tell a story, but not in a way that’s compelling and easy to digest.
At a glance, a graph can help you visualize where your cash flow is headed, whether your current strategies are working, or if it’s time to make certain investment decisions.
Graphs make it easier for stakeholders to interpret data, but it’s important to incorporate the right graphs into your reports.
Essential Cash Flow Graphs for Effective Business Management
While there are many types of cash flow graphs you can use, these six are the most essential.
1. Cash Flow Statement Graphs
Cash flow statements help you understand your cash flow from operations, investing and financing. Graphs allow you to visualize this data, so you can see, at a glance, where your money is coming from and where it’s going.
2. Operating Cash Flow Trends
With this type of graph, you can quickly identify changes in your operating cash flow. You can compare the current year’s operating cash flow to previous years or create quarterly comparisons.
3. Accounts Receivable Aging Graphs
Graphs can bring your accounts receivable aging report to life and really help you determine whether your AR collections process is efficient and effective.
These graphs will show the length of time invoices are outstanding.
Along with improving your AR collections, these charts can help you identify late-paying customers or clients.
4. Accounts Payable Tracking
Tracking expenses is critical for every business, but textual reports can make it difficult to really understand the impact of overspending in certain areas.
Graphs can help you see where your cash is going and whether you may need to cut back or eliminate certain expenses.
5. Inventory Turnover Visualizations
Inventory turnover helps you understand how quickly your products are selling. Low inventory turnover indicates that demand is low, or you’re purchasing too much stock. A high turnover indicates that you’re selling off stock quickly.
Higher turnover rates are generally better for cash flow.
Like other essential data, it’s difficult to visualize inventory turnover. Line charts, histograms and area charts can help you understand where your turnover rate is at and if you need to improve.
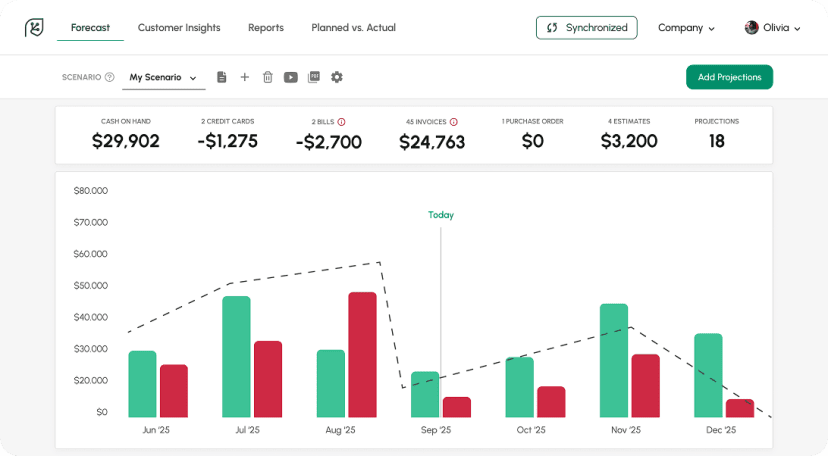
6. Projection vs. Actual Cash Flow Comparisons
Projections vs. actual cash flow charts can help you understand whether your projections are accurate or need improvement. These graphs are the ultimate in cash flow visualization and can help you improve your forecasting process.
Using Technology to Create and Analyze Cash Flow Graphs
No one should create a cash flow graph by hand when technology can do it for you. You’ll find that Cash Flow Frog offers:
Integrating Accounting Software for Real-Time Graph Generation
Fast and easy integration into your account software, empowering you to gather data from multiple sources in seconds. You never need to add data manually when software does it for you in real-time.
And you'll also improve data accuracy and consistency by connecting your cash flow and accounting software.
The Role of Data Visualization Tools in Cash Flow Analysis
A money flow diagram is a powerful tool that helps stakeholders visualize the success of a business. Cash flow analysis is much easier with visualization tools because:
- It's easier to view the company’s growth
- You can identify periods of growth or contraction
It's easier to show growth in a visual than it is to show just the figures, especially when you tailor your graphs to your business needs.
Tailoring Cash Flow Graphs for Your Business Needs
Your business’s cash flow chart must be unique. If you’re not tailoring your graphs to follow key metrics that are important to your specific company, you’re missing out on potential insights that can change the course of your company.
For example, you can:
Customizing Graphs for Different Industries
What industry are you in? You can customize your graph to show cash flow for:
- Each business segment you operate in
- Market
- Etc.
If you’re a startup, you may be able to skip this customization because you have one main product or service that you sell.
Adapting Graphs for Startups vs. Established Enterprises
Startups and enterprises both want to achieve growth and see this growth represented in a graph. You need to adapt the graph to:
- Show initial growth in a startup
- Demonstrate growth across multiple channels as an enterprise
Incorporating Key Metrics into Your Cash Flow Graphs
What is included in your cash flow diagram? Your graph should be broken down into categories that are most important to you. Perhaps you need to have a graph that shows cash flow changes over:
- Business quarters
- Weekly
- High seasons
- Low seasons
- Daily
Every business has different goals. Sit down with key stakeholders and begin incorporating key metrics into your graphs that will help you inch closer to your goals.
Navigating Business Decisions with Insights from Cash Flow Graphs
Accounting software can help provide quick insights into your business’s cash flow to:
- Making informed investment decisions
- Identifying opportunities for cost savings
- Managing seasonal fluctuations in cash flow
You can change your cash flow curve by doing two things very well: identify changes in cash flow and find opportunities in the data available.
Collaborative Analysis and Decision-Making Using Cash Flow Graphs
Graphs are visuals that you can use to accurately portray your business’s cash flow to key stakeholders. For collaboration, graphs are unmatched and allow the following:
The Role of Cash Flow Graphs in Team Discussions
Team discussions are the key point of all meetings. If you want to hold a meeting with investors, team leaders, groups or employees, you need to be able to capture their attention and hold it.
How can you do this?
Show them cash flow graphs. Your graph will show:
- Cash flow growth or contraction
- Cash – the main attention grabber in business
Teams can comment on the data and visualize it in ways that are simply not possible without a graph. Collaborative analysis requires everyone to be on the same page and graphs can help.
Using Graphs to Communicate Financial Health to Stakeholders
Stakeholders and potential investors want to learn of the business’s financial health. If your business is doing well and you can show this on the graph, you can:
- Attracts investors
- Reassure stakeholders of the business’s financial health
Alternatively, if the graph shows the company’s financial health declining, you can communicate the ups and downs to stakeholders in a visual way.
Ensuring Long-Term Financial Sustainability with Cash Flow Graphs
Financial analysis is a part of running a business. Two-in-three businesses face financial challenges. Newer companies that are just starting to secure clients or sell their products will have some financial hiccups along the way.
But if you want to ensure that you have long-term sustainability, you need to:
- Monitor key financial metrics
- Use graphs to see growth or contraction
If you focus on long-term financial stability, you will avoid the 7 reasons why small businesses fail.
Establishing Cash Reserves Based on Graph Insights
For example, perhaps you want to have a cash reserve to invest heavily in new equipment or acquire a competitor. You may need to have $150,000 in cash reserves, but you’re starting at $20,000.
Graphs provide the insights that you need to monitor:
- Cash reserve growth
- When cash goes up or down
- Progress over time
Of course, you can swap out “cash reserve” with any other financial goal that you’re trying to reach or monitor.
Adapting Strategies to Maintain Positive Cash Flow Trends
Financial sustainability means focusing heavily on positive cash flow. You can maintain your positive cash flow trends by adapting these strategies:
- Automate invoice sending
- Borrow capital
- Lease when buying is too costly
- Open a personal and business bank account
Daily, work to find ways to maintain your positive cash flow trends.
Conclusion
Cash flow is one of the most crucial metrics that you can follow. You can only make smart, data-based business decisions if you have proper cash flow metrics to follow. Graphs and Cash Flow Frog can help you grow your business.
New: Setting threshold
Read more

5 Key Financial Metrics Every Business Owner Should Track
Read more
What Is Profitability Analysis and How to Do It?
Read more
Best QuickBooks Online apps
Read more
How To Calculate Adjusted EBITDA and Why Is It So Important?
Read more

Best cash flow forecasting software
Read more
Trusted by thousands of business owners
Start Free Trial Now