New tooltips help you see your balances at any point on the graphs
We’ve added new tooltips to the cash flow graphs and charts to help you see the exact amounts at any point in time. This is an essential feature of any cash flow graph.
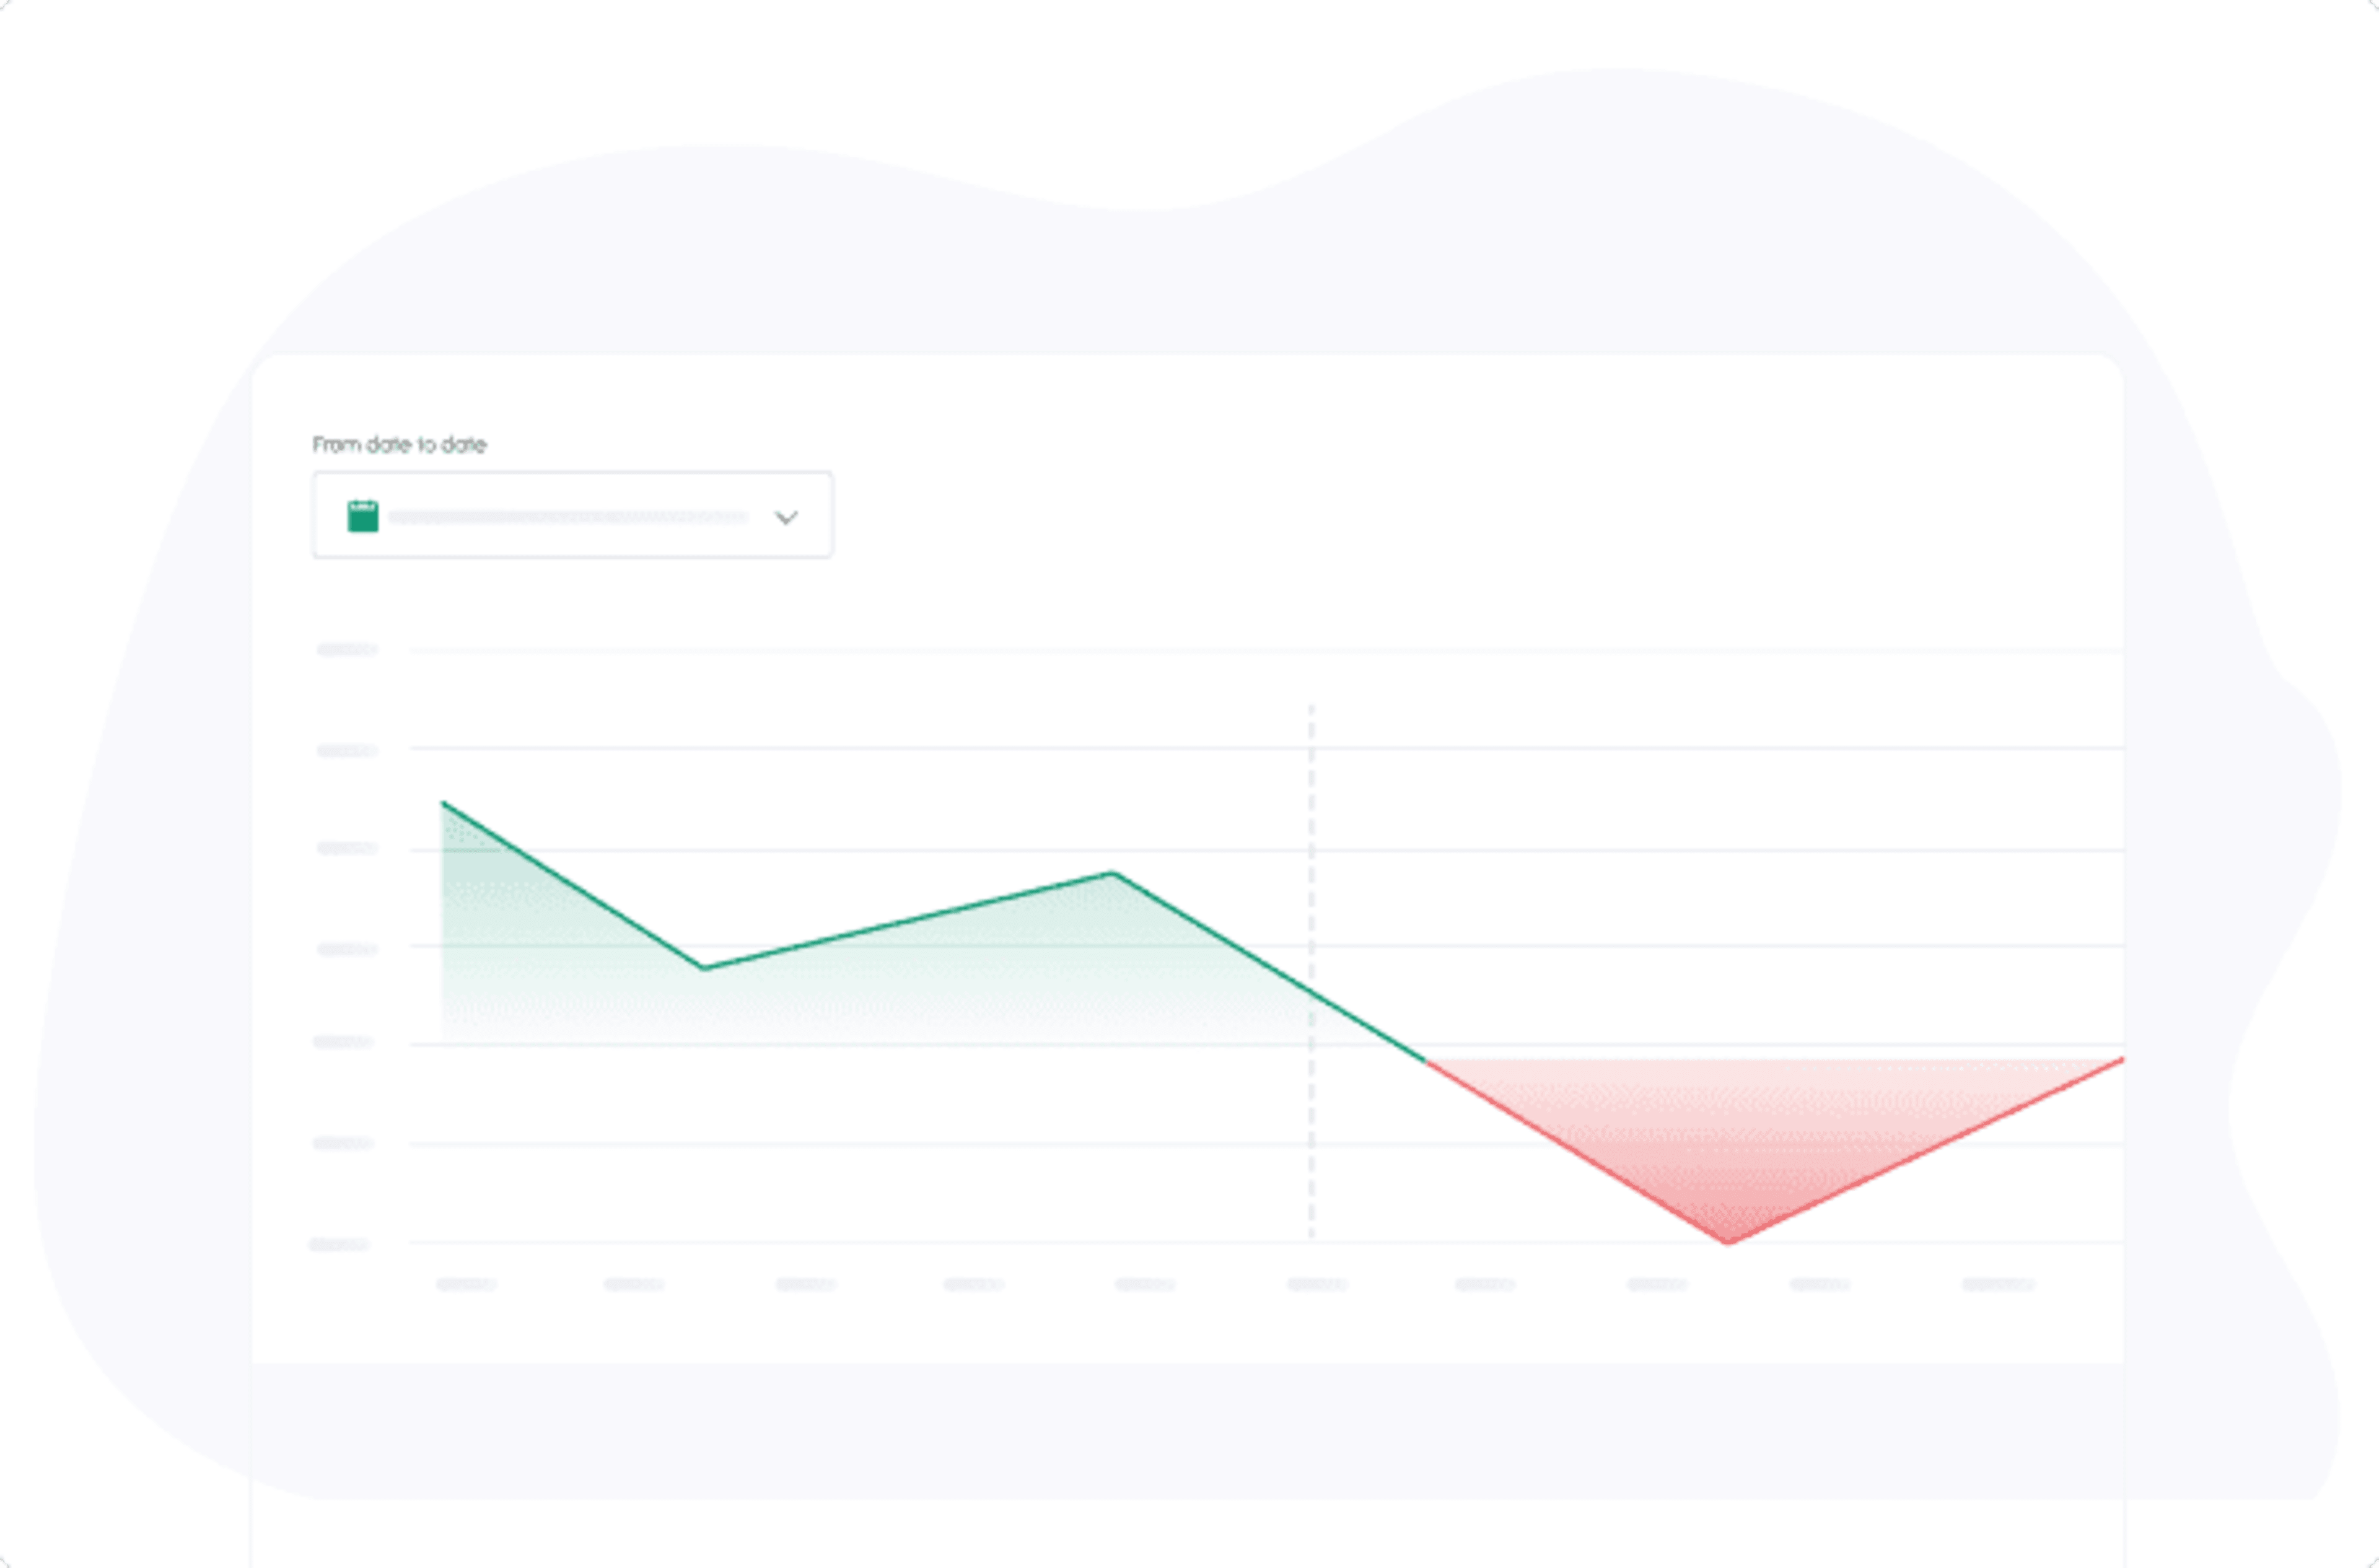
Every graph has a slightly different tooltip. The tooltip in the Cash Balance graph shows the actual/expected cash balance on the specific date you’re pointing to:
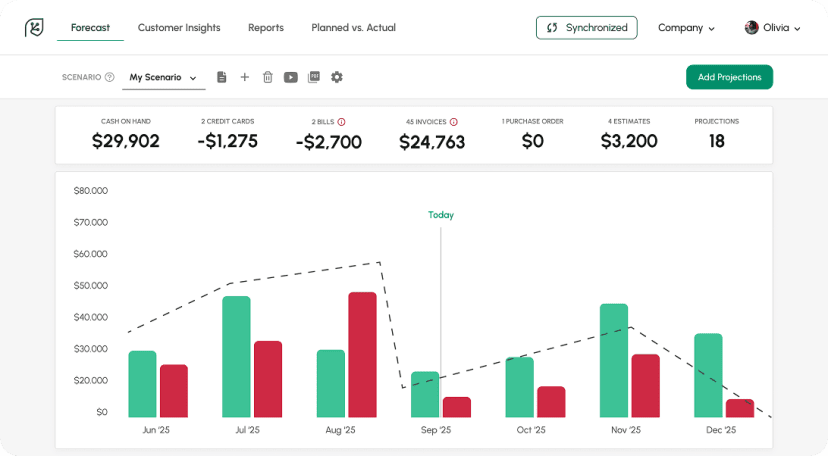
The tooltip in the Monthly graph shows the actual/expected cash-in, cash-out, monthly total and cash balance amounts:
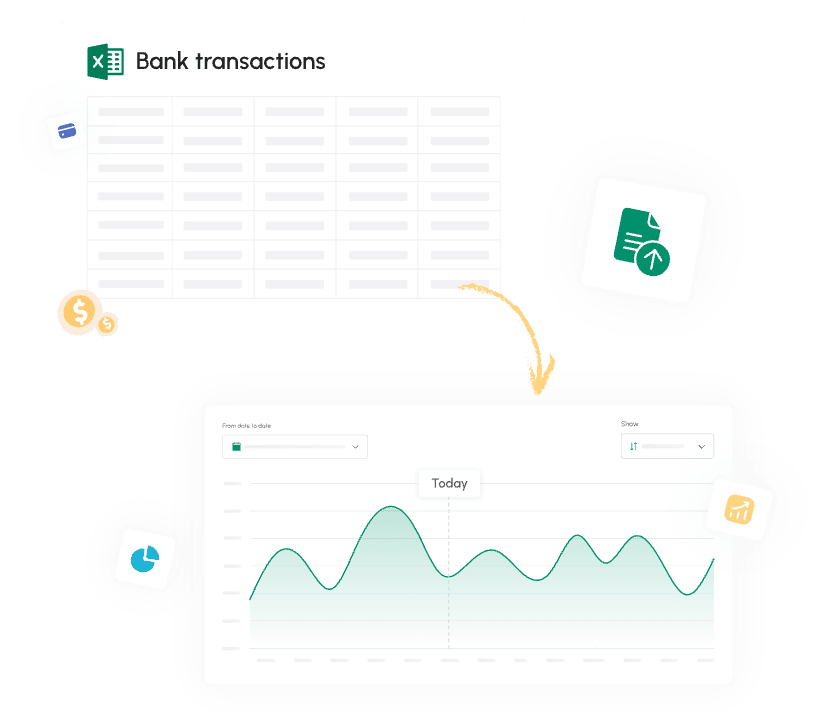
The tooltip in the Cash in/out pie charts shows the total amount per type, during the time period you have selected:
New: Setting threshold
Read more

5 Key Financial Metrics Every Business Owner Should Track
Read more

What Is Profitability Analysis and How to Do It?
Read more

Best QuickBooks Online apps
Read more
How To Calculate Adjusted EBITDA and Why Is It So Important?
Read more

Best cash flow forecasting software
Read more
Trusted by thousands of business owners
Start Free Trial Now