MIS Reports: Meaning, Types & Examples
What Is an MIS Report?
An MIS report is a formal report that pulls data from across a business (accounting software, sales systems, bank feeds, inventory records) and presents it in a consistent format managers can act on. The "MIS" stands for Management Information System: the mix of software and processes a business uses to collect its data and turn it into usable information.
A few things separate an MIS report from a raw data export:
- It is summarized for a decision. A list of 4,000 invoices is data; "receivables over 60 days grew 18% this quarter, driven by two customers" is an MIS report. (Figures here are an illustrative example.)
- It is recurring and comparable. MIS reports are produced on a fixed cadence (daily, weekly, monthly) in the same format, so this month can be compared against last month.
- It is matched to its reader. An operations manager gets daily order and stock figures; the owner or CFO gets monthly profit and cash-flow trends. Same underlying data, different report.
A small business doesn't need an enterprise "MIS department." The data already sits in your accounting platform and bank feed, and MIS reporting is just the discipline of summarizing it on a schedule.
What Does MIS Reporting Mean?
MIS reporting means the ongoing process of collecting business data, converting it into standardized reports, and getting those reports to the people who make decisions. Where an MIS report is the document, MIS reporting is the system that produces it on schedule.
In practice, MIS reporting covers four recurring activities:
- Collection: pulling data from source systems (accounting software, POS, CRM, bank accounts) rather than re-keying it by hand.
- Standardization: putting the data into the same structure every period so trends are visible.
- Analysis: comparing actuals against budgets, prior periods, and forecasts; flagging exceptions.
- Distribution: getting the right report to the right level of management at the right cadence.

Accountants and bookkeepers often run MIS reporting for their clients: a month-end package with a P&L summary, AR/AP aging, and a cash-flow view is MIS reporting, even if nobody in the engagement letter calls it that.
How Do MIS Reports Work?
An MIS report is built by pulling raw data from across the business, organizing it, analyzing it, and presenting it in a form a manager can use. In practice it runs in four steps:
- Data collection: figures come from sales logs, inventory databases, bank feeds, and accounting software.
- Data organization: the data is sorted and grouped around the decision the report supports.
- Data analysis: software tools surface trends, outliers, and anything that needs attention.
- Report generation: the result is laid out as charts, graphs, and tables a reader can act on.
Modern tools automate the collection step by connecting directly to your accounting software and bank, which removes the manual export that makes reports late or wrong.
What Are the Types of MIS Reports?
There are eight common types of MIS report, each built for a different decision. Each one below has a short definition and a worked example. All numbers in this section are illustrative, not real customer data.
1. Summary MIS Reports
A summary report rolls up performance across the whole business into one view: revenue, gross margin, headline expenses, inventory position.
- Worked example (illustrative): A 12-person e-commerce business produces a monthly one-pager: revenue $214,000 (vs. $198,000 budget), gross margin 41%, ad spend $32,000, closing inventory $145,000. The owner reads it in five minutes and asks one question, why margin dropped from 44%, instead of opening four systems.
2. Trend MIS Reports
Trend reports plot the same metric across periods to expose direction: is the number improving, flat, or decaying?
- Worked example (illustrative): A services firm tracks average days-to-payment by month: 31 → 34 → 39 → 44 over four months. No single month looks alarming; the trend report shows collections are slipping and triggers a credit-policy review before it becomes a cash crunch.

3. Profit MIS Reports
Profit reports compare actual profit to projected profit and break down which products, customers, or segments drive the result, or drag it down.
- Worked example (illustrative): A wholesaler's profit report shows overall net margin of 9%, but by segment: product line A at 17%, product line B at 2%. Without the segment split, line B's underperformance would stay hidden inside an "acceptable" total.
4. Inventory MIS Reports
Inventory reports show stock levels, turnover, best-sellers, and dead stock. They are the operational bridge between sales and purchasing.
- Worked example (illustrative): A retailer's report flags 220 units of a seasonal SKU with zero sales in 60 days ($13,000 of tied-up cash) while the top seller has 9 days of cover left. The purchasing decision writes itself.
5. Cash Flow MIS Reports
Cash-flow reports track money actually moving in and out (receipts, payments, and the resulting bank position) separately from profit. A business can be profitable on paper and still miss payroll; this is the report that catches it.
- Worked example (illustrative): A contractor's weekly cash report shows $48,000 of expected receipts, $61,000 of committed payments (payroll, subcontractors, materials), and a $19,000 opening balance, projecting a $6,000 surplus, but only if the two largest invoices land on time. That "only if" is the decision: chase those two invoices Monday, not at month-end.
This is typically the highest-stakes MIS report for a small business, and the one that benefits most from automation, covered in the cash-flow visibility section below.
6. Accounting MIS Reports
Accounting reports summarize the formal financial statements (income statement, balance sheet, tax and compliance summaries) for management review rather than statutory filing.
- Worked example (illustrative): The month-end accounting pack a bookkeeper sends a client (P&L vs. budget, balance-sheet snapshot, AR/AP aging) is an accounting MIS report. The accountant adds two lines of commentary; that commentary is what makes it MIS reporting rather than a data dump.
7. Sales MIS Reports
Sales reports break revenue down by product, region, channel, and rep, and track pipeline and customer-acquisition metrics over time.
- Worked example (illustrative): A SaaS company's monthly sales report shows new MRR of $11,400 against a $10,000 target, but customer acquisition cost rose from $620 to $890. The headline beat hides a unit-economics problem the report surfaces.
8. Exception MIS Reports
Exception reports list only what's abnormal (entries outside tolerance, unusual transactions, missed thresholds) so managers review the 2% that needs attention instead of the 98% that doesn't.
- Worked example (illustrative): An exception report flags three supplier payments above the $5,000 approval threshold that skipped the approval step, and one duplicate invoice number. Each item is a five-minute check; without the report, none would be checked at all.
MIS Report Example: A Month-End Walkthrough
Here's what producing a real MIS report looks like for a small business, end to end. The scenario and all figures are an illustrative example.
Take a 15-person design agency closing out April:
- Step 1: Pull the data. The bookkeeper syncs the accounting platform (invoices, bills, payroll) and the bank feed. No spreadsheets re-keyed; the source systems are the source of truth.
- Step 2: Standardize. Numbers drop into the same month-end template used every month: revenue, costs, AR/AP aging, cash position, and a 13-week cash-flow forecast.
- Step 3: Compare. April revenue: $96,000 vs. $90,000 budget. Cash collected: $71,000, well behind billing, because two retainer clients are now 50+ days out. Projected June cash position: $12,000 below the level needed to cover payroll comfortably.
- Step 4: Flag exceptions. The report highlights the two late-paying clients by name, plus a software subscription that doubled in price.
- Step 5: Decide and distribute. The owner gets a one-page summary with three actions: call the two late payers this week, run a what-if scenario on delaying a planned hire by one month, cancel or renegotiate the subscription. The full pack goes to the accountant.
April's data became three specific decisions before May was a week old. Done quarterly instead of monthly, the same review would have found the cash gap after it happened, not before.
Real-Life Examples of MIS Reports by Industry
MIS reports look different in each industry. Here is how five sectors use them, and which report type from the list above each one leans on.
- Retail. Retailers track sales trends and best-sellers to keep fast-moving items in stock and clear slow ones. This is mostly inventory and sales reporting.
- Manufacturing. Manufacturers track production efficiency and supply chains to find bottlenecks, such as a delay in raw-material procurement that needs an immediate fix. This leans on inventory and exception reports.
- Customer service. Support teams watch response times and customer-satisfaction scores to improve service quality, usually through trend reports.
- Healthcare. Hospitals and clinics analyze patient admissions, resource use, and outcomes to allocate staff and improve care, drawing on summary and trend reports.
- Finance and banking. Finance teams track cash flow, monitor loans, and analyze profit to watch liquidity, risk, and compliance. This combines cash-flow, profit, and exception reports.
The pattern holds across sectors: the useful MIS report is the one matched to the decision in front of you.
How Are MIS Reports Generated?
MIS reports can be built by hand or with software. The process has a few stages:
- Gather the data. Pull raw figures from each function (sales, inventory, finance) from the POS system, accounting software, or CRM.
- Organize it. Group the data around the report's purpose. An inventory report focuses on stock levels, turnover, and sales trends; a profit report focuses on revenue, expenses, and margins.
- Analyze it. Surface patterns, trends, and anomalies, with analytical tools handling the volume and keeping it accurate.
- Present it. Lay the analysis out as charts, graphs, and tables so stakeholders can read and act on it.
- Verify and format. Confirm the figures and format them into clean, branded reports.
The verify step is where manual MIS reporting usually breaks down: re-keyed numbers go stale or wrong between the export and the finished report. Pulling data straight from your systems is what keeps that step reliable.
MIS Reports for Different Levels of Management
Different levels of management need reports matched to their responsibilities:
- Operational management: daily/weekly reports on day-to-day metrics: inventory levels, sales figures, order status.
- Tactical management: weekly/monthly reports tied to departmental goals: trend reports, cash-flow reports, budget-vs-actual.
- Strategic management: monthly/quarterly reports for long-term planning: profit analysis, market trends, multi-scenario forecasts.

How Does MIS Reporting Improve Cash Flow Visibility?
Of the eight report types, the cash-flow MIS report is the one where timing matters most. A profit report that's two weeks late is annoying; a cash report that's two weeks late can mean a missed payroll. It's also the report most small businesses still build by hand, exporting bank data into a spreadsheet each week.
Good cash-flow MIS reporting needs a few things:
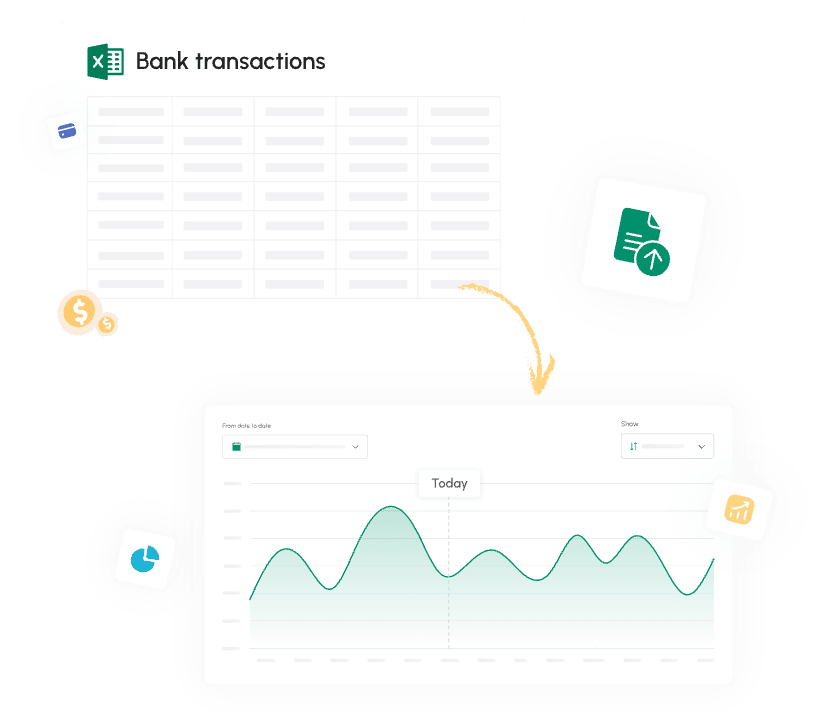
- Live data, not month-old exports. The report is only as current as its inputs. Pulling AR, AP, and bank activity directly from the accounting platform, which Cash Flow Frog does for QuickBooks, Xero, Sage Intacct, Odoo, and Zoho Books (or your bank via Plaid), removes the manual export step where reports go stale.
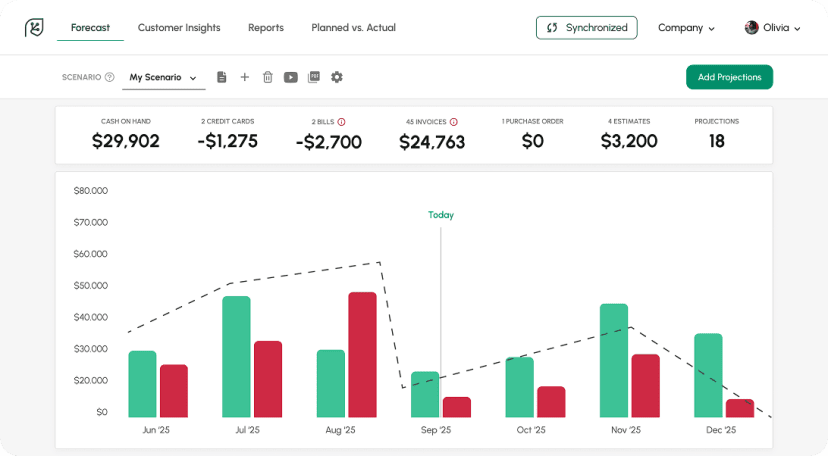
- A forward view, not just a rear-view. A statement of past cash flows is accounting; a cash-flow MIS report should also project forward (expected receipts, committed payments, and the resulting runway) so the exceptions it flags are still fixable.
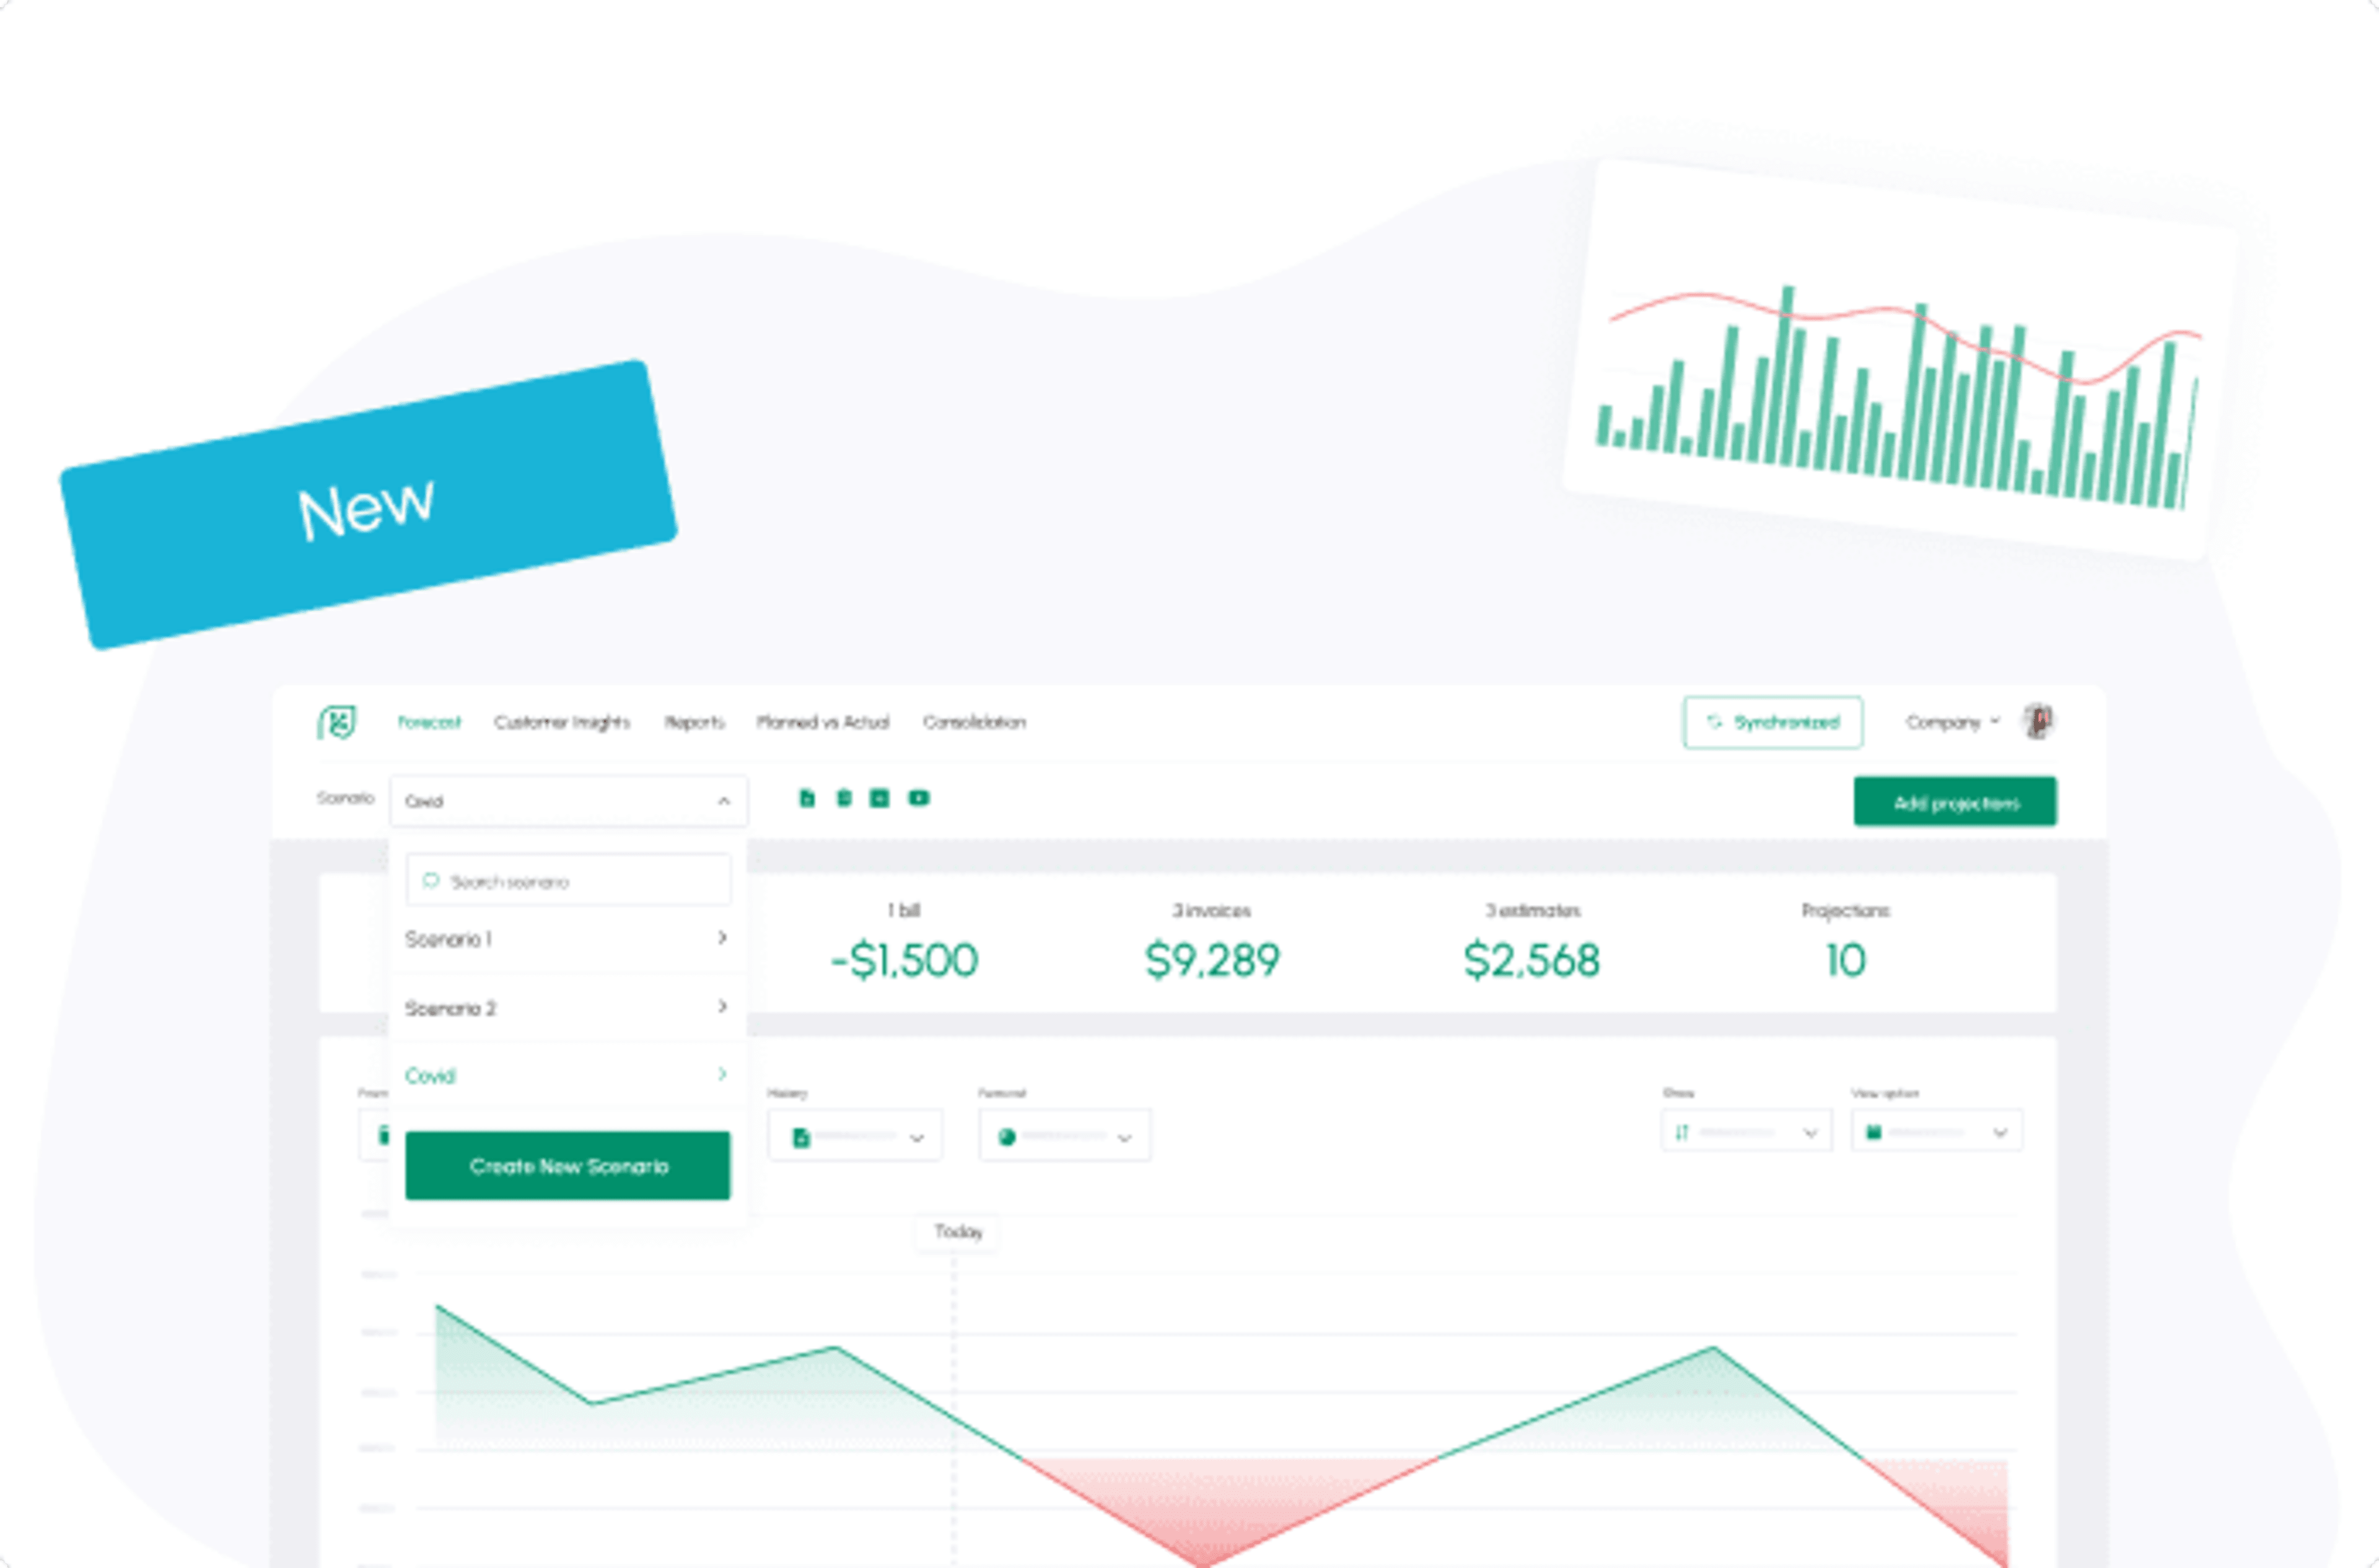
- Scenario modeling. The decisions a cash report drives are what-ifs: what if that client pays 30 days late, what if we make the hire now versus next quarter. A reporting setup that lets you model those scenarios turns the report from a status update into a planning tool.
For accountants and bookkeepers running MIS reporting for clients, this is the report worth standardizing first across the client book: it's the one clients ask about between meetings, and a client-ready forecast view answers the question before it's asked.
Why Are MIS Reports Important?
MIS reports turn raw data into information leaders can act on. Four reasons they matter:
- Better decisions. A financial MIS report surfaces cash-flow and profitability trends, so you weigh an expansion, a new product, or a dip in sales against real numbers.
- Clearer communication. A standard summary lets managers, staff, and investors read the same performance picture, which builds trust.
- Trends spotted early. Patterns in historical data feed long-term planning, so you see challenges and opportunities before they arrive.
- Accountability. A regular reporting cadence keeps each function measured against its goals.
Run them on a fixed schedule and the business stays ahead of problems instead of reacting late.
Conclusion
MIS reports are how a business turns the data it already has into decisions made on time. Start with the report tied to your biggest risk. For most small businesses, that's cash flow. Put it on a fixed cadence, and pull the data from your systems rather than re-keying it. Once one report runs reliably, the rest of the taxonomy above is incremental.
New: Setting threshold
Read more

5 Key Financial Metrics Every Business Owner Should Track
Read more

What Is Profitability Analysis and How to Do It?
Read more

Best QuickBooks Online apps
Read more
How To Calculate Adjusted EBITDA and Why Is It So Important?
Read more

Best cash flow forecasting software
Read more
Trusted by thousands of business owners
Start Free Trial Now