Dashboards Made Simple
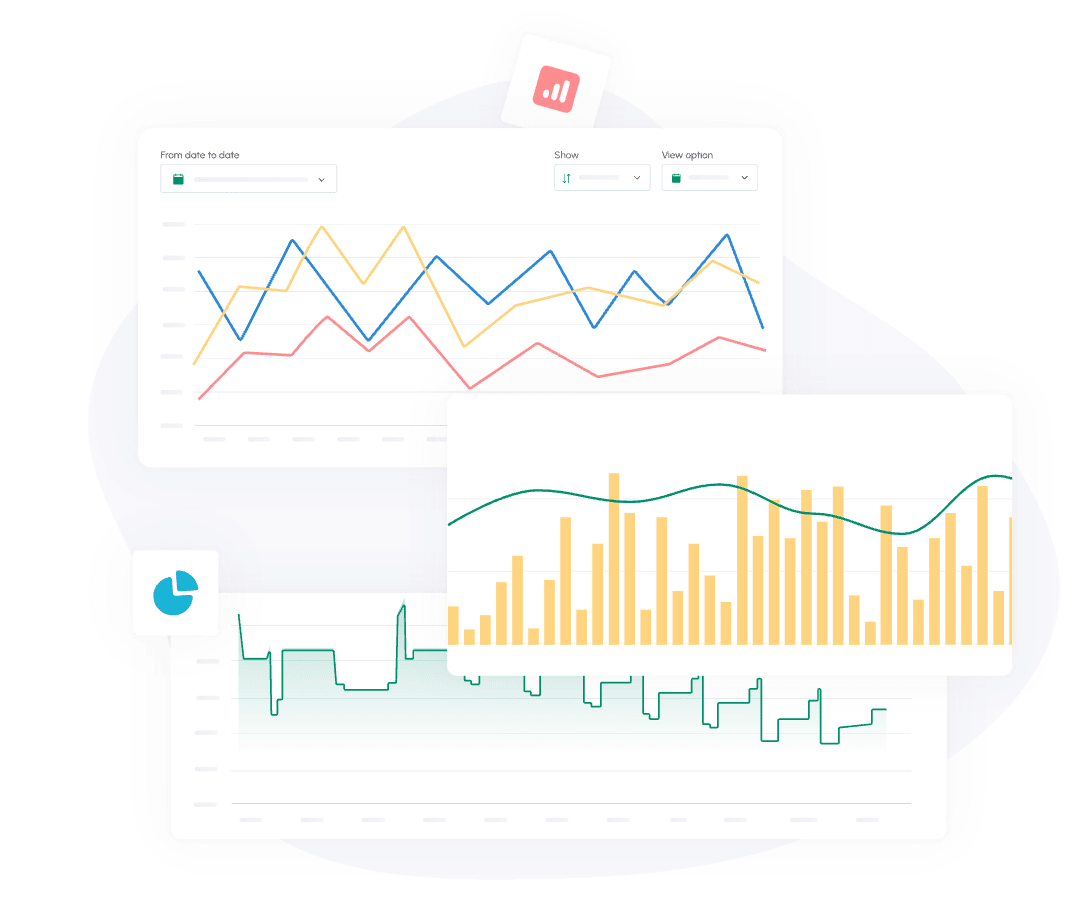
Cash Flow Frog’s cash flow dashboards provide an intuitive, clean interface to view cash on hand, current cash status, future cash projections and more. Instantly see your business's most important data and eliminate unwanted surprises.


Cash flow dashboard goals
Tired of cumbersome data that you can’t easily read? Struggling to see your cash flow doesn’t help your business make smart, spur-of-the-moment decisions. We've redefined what a metric dashboard should be. Use the cash flow analysis dashboard to:
- Run beautiful, easy-to-read reports
- Plan out cash flow
- Update reports in minutes
- Provide a clear, concise way to manage cash flow
Our cash flow analysis dashboard software is designed to make your business run smoother while empowering management to make smart business decisions.
Dashboard Metrics and KPIs
Your business relies on metrics and KPIs to track goals and progress. And your metric dashboard should help you reach these milestones. Cash Flow Frog knows your business is unique. However, we also know that the top five metrics and KPIs are crucial to your business success.
Ready to take control of your cash flow?
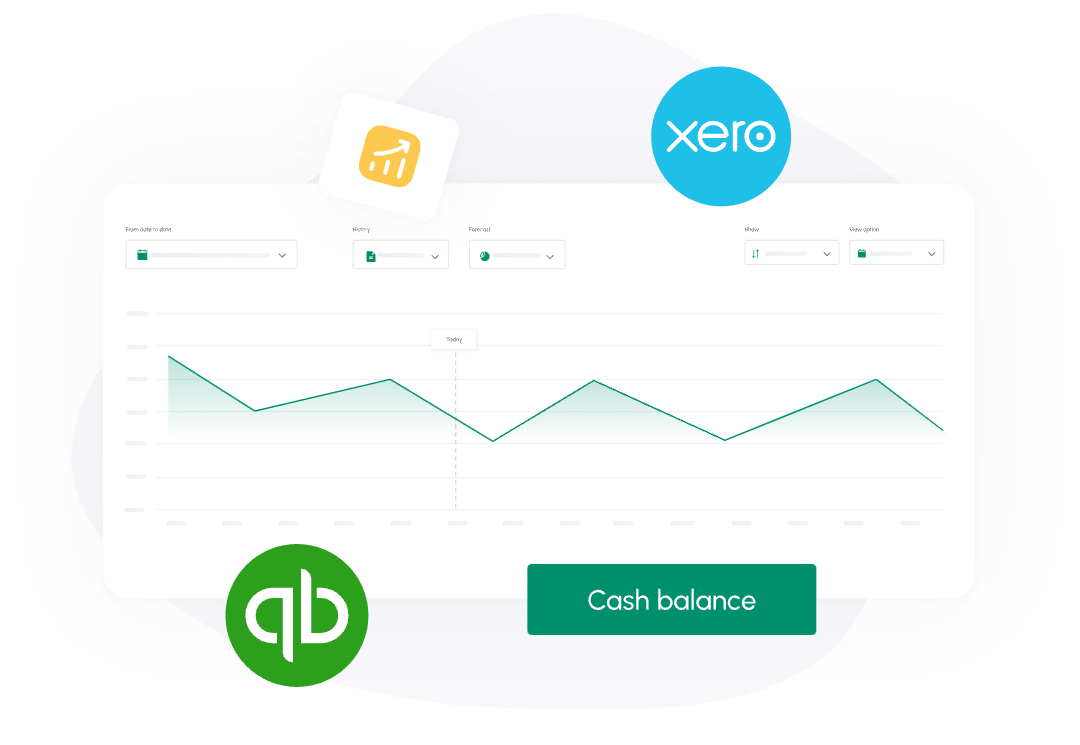
It makes cash flow forecasting dead simple, all QuickBooks updates are automatically updated in the app, new invoices or bills are integrated into the forecast.
Maria Davis

Our dashboard places the most important KPIs and metrics at your fingertips, including:
Cash walkthrough
- A complete, real-time view of cash flow that walks stakeholders through multiple stages of cash balance, with concrete data and inflows provided.
Consolidated actual and forecast cash positions
- Direct bank data and forecasting are fed into the dashboard to show consolidated and forecasted cash positions accurately. In addition, real-time, daily views are available.
Total actual and forecast available liquidity
- Liquidity data is aggregated across multiple sources to show actual and forecast cash reserves right on the dashboard.
Net debt and covenants
- Debt and covenants are present to show cash flow changes in short periods of time.
Variance and actual versus forecast analysis
- Actual and forecast data is present on the dashboard enable stakeholders to better understand forecasts and major impacts impacting them.
Cash flow analysis panel features
Cash Flow Frog’s cash flow management dashboard is built with feature-rich insights that empower stakeholders to make accurate, data-backed decisions. Our panel features the data you need today to make your business grow tomorrow. Features include:
- Current cash on hand - Quickly view cash on hand, learning how much free cash your business has to buy inventory, pay employees or make an acquisition.
- Current cash status - Cash status can vary across multiple “cash” types. Rapidly view the cash status of money that is tied up in credit cards, bills, invoices, POs, estimates and cash.
- Future cash on hand - What will your cash flow look like in a week or month from now? Your dashboard provides future cash-on-hand predictions and forecasts to plan out the quarter.
- Future cash vs. threshold - Cash flow keeps businesses operational. View future cash flow and thresholds that must be met to continue growing and running your business’s operations.
- Multiple perspectives - Perspectives can be adjusted to understand cash flow on a daily, weekly, monthly and quarterly basis. View different perspectives in seconds to understand cash flow strengths and weaknesses.

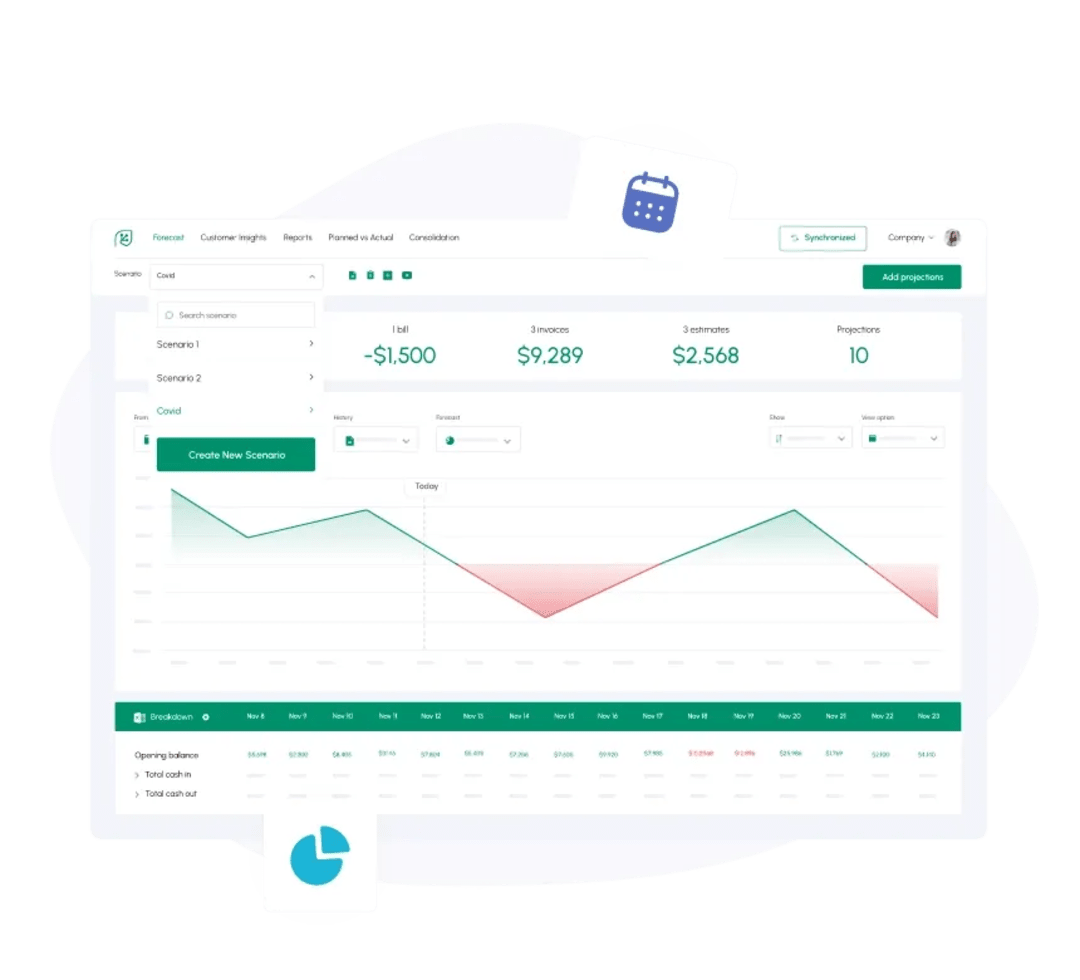
Advanced features
Planned cash flow vs. actual results - Actual and planned cash flow can be charted and examined using our intuitive dashboard. Rapidly view results and variances in planned cash flow that may need strengthening.
Cash in analysis - Cash in allows stakeholders to analyze accounts, class, cost center and type of cash inflows to understand how money flows into the business.
Cash-out analysis - In-depth cash out analysis provides a breakdown of all cash spent based on account, class, cost center and type to have a clear overview of how your business is spending its money.
Expected VAT / GST payments - UK, Australia and New Zealand have strict VAT and GST payments. View the payment requirements on the dashboard to eliminate accounting surprises.
Expected income- Income expectations drive decisions. Uncover expected income from a wealth of data sources to better plan out your business quarter.
Expected expenses - Expenses impact cash flow. View expected expenses to make smarter business decisions based on inflows and outflows.
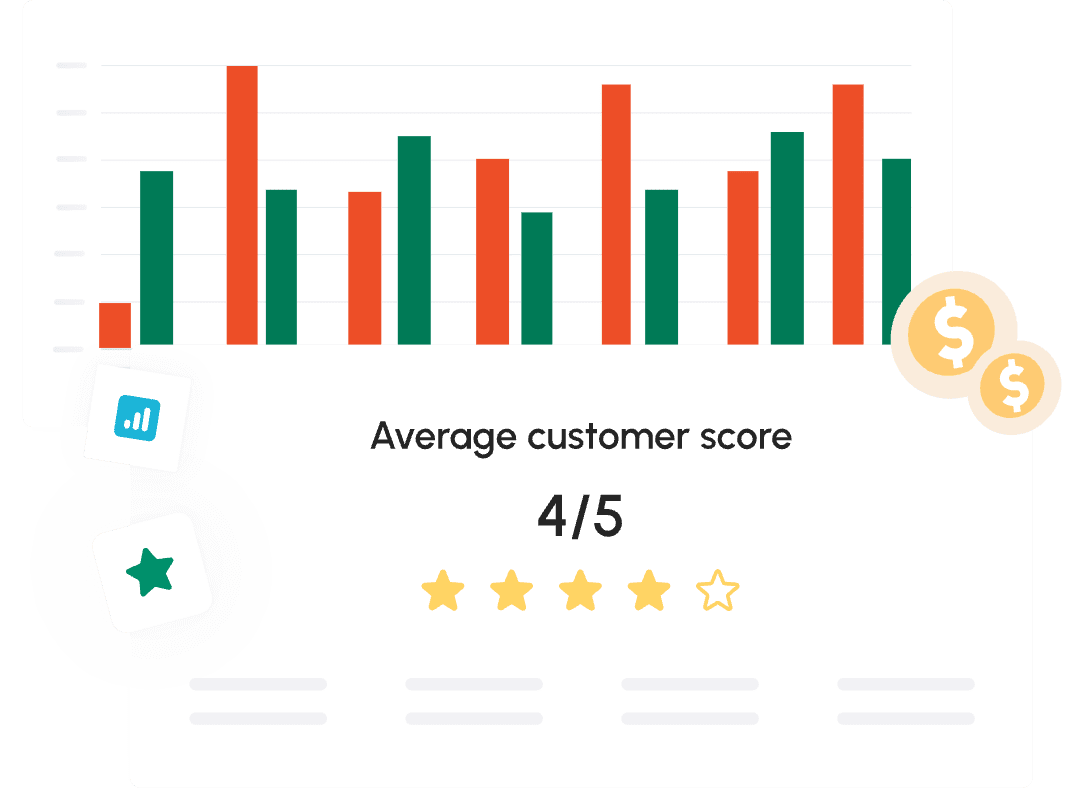
Customer insights - Which customers are paying and what credit terms have been extended to customers? Are customers behind on their invoices? Gain valuable customer insights.
Advantages of using our cash flow dashboard
Cash flow impacts all areas of your business’ operation. Our free cash flow dashboard gives offers many benefits, including:
- A quick view of liquidity
- Accurate profitability position
- Empower business decisions
- Know when financing is necessary
- Learn when your business can invest
From quarterly and weekly cash flow dashboard reports to monthly options, our platform works to strengthen your decision-making process.
Cash Flow Frog makes big data simple, highlighting the key cash flow metrics your business needs to understand in an intuitive, powerful, feature-rich dashboard. Run reports, view cash flow in real-time and do it all with the help of Cash Flow Frog.
Track your cash flow metrics in real time
Get Answers
Can I brand the dashboard?
Yes, Cash Flow Frog let's you use your own logo, so the dashboard reports you export to your stakeholders have your brand.
FAQ
A cash flow analysis dashboard is a dashboard that helps a company monitor its current cash status and a high level cash flow overview. It’s important for businesses to track their cash flow. Cash flow dashboards help them achieve that goal. Data is displayed in real-time and generated by forecasting and reporting.
Cash flow dashboards should include:
- Cash on hand
- Net cash flow
- Outstanding invoices and estimated
- Outstanding bills and purchase orders
- Threshold
- Revenue pipeline
Dashboards can include a wide range of data to help businesses track their cash flow and spending.
Cash flow dashboards can be created using tools like Cash Flow Frog or Excel. They can be customized to include your most important data and connect with accounting software to ensure that your data is accurate.
Choosing cash flow analysis dashboard software is a personal decision and one that should be made based on your company’s needs and budget. The best software is easy to use, affordable and offers automation to streamline your cash flow management.
Choosing the right metric dashboard doesn’t have to be complicated. Incorporate metrics that directly impact cash flow and the financial health of your business. These might include your gross profit, cash in the bank, expenses and profitability.
Get your Dashboards in seconds
Start Free Trial Now