Sales Conversion Rates: Benchmarks, Formulas, and Growth Tactics
What is the sales conversion rate becomes the question teams confront when effort stops matching results. Campaigns attract attention. Sales calendars stay full. Activity reports look healthy. Revenue, however, grows more slowly than expected.
Where does the breakdown occur? Why do strong pipelines fail to translate into steady income?
Sales conversion rate exposes the answer. It governs what happens after interest is secured but before commitment is earned. Small changes in that interval determine what’s a good sales conversion rate for a business, whether effort accumulates into revenue or dissipates through delays, misalignment, and stalled decisions.
What exactly is a Sales Conversion Rate?
Sales conversion rates measure the percentage of people who complete a defined action after interacting with your business. That action depends on how revenue is generated. In sales-led organizations, the action usually means a deal reaching closed-won status. E-commerce asks, “Did they buy?” Subscription businesses ask, “Did they commit?” High interest with weak conversion usually means the offer does not match the buyer’s reality.
This metric reflects how sales conversion rates respond to alignment between buyer expectations and business execution. A company may attract strong interest while struggling to close if pricing, timing, or qualification don't align with the buyer's reality.
To see the sales conversion rate definition applied in practice, consider a regional logistics provider. During one quarter, 150 companies requested freight quotes. 30 sign contracts. The conversion rate equals 20 percent. The company later filters inbound requests by shipment volume and delivery frequency. Requests fall to 110. Signed contracts rise to 33. Conversion increases to 30 percent, and sales resources focus on higher-value opportunities.
Marketing tracks early actions. Sales tracks closed deals. Without alignment, conversion numbers mislead.
Discover what the sales conversion rate is at each stage of your pipeline.
Sign up todayHow do you calculate the sales conversion rate?
The calculation behind sales conversion rates is straightforward, though interpretation often is not. Most errors originate from inconsistent inputs and a loosely applied sales conversion rate definition. Conversion rate only delivers insight when opportunity definitions remain consistent over time.
The universal formula for quick math
Sales conversion rates rely on a simple formula, yet that simplicity often hides where teams go wrong. The metric answers one question: out of everyone who realistically could have converted, how many actually did.
Sales Conversion Rate = (Completed Conversions ÷ Total Opportunities) × 100
Each part of the formula matters. “Completed conversions” refers only to the action that defines success for that specific process. “Total opportunities” includes everyone who had a genuine chance to take that action. Multiplying by 100 converts the ratio into a percentage that is easier to interpret and compare.
In e-commerce, opportunity begins when a visitor reaches a product or pricing page. Every visitor has the ability to purchase, so each one counts as an opportunity.
- Total visitors: 500
- Purchases completed: 20
Sales Conversion Rate = (20 ÷ 500) × 100 = 4 percent
That result means 4 out of every 100 visitors completed a purchase. The figure defines performance without explaining individual drop-off reasons.
Now compare that with a B2B sales environment, where the sales conversion rate's meaning shifts with qualification. A sales team may generate hundreds of inquiries. But opportunity does not begin with every inbound inquiry. It begins after the qualification confirms the budget, authority, and an active need.
If a sales team qualifies 120 leads in a quarter, those 120 leads define the opportunity set. When 18 converts into signed deals, the calculation looks like this:
Sales Conversion Rate = (18 ÷ 120) × 100 = 15 percent
This result shows that 15 out of every 100 qualified leads became customers. The higher percentage compared to e-commerce reflects stronger buying intent at entry, not superior execution on its own.
The examples below show how the same formula produces very different outcomes depending on context.
| Scenario | Total Opportunities | Conversions | Conversion Rate |
|---|---|---|---|
| E-commerce pricing page | 500 visitors | 20 purchases | 4 percent |
| B2B sales pipeline | 120 qualified leads | 18 deals | 15 percent |
Opportunity definitions must match how buyers actually purchase. When they do not, results become misleading, and the sales conversion rate's meaning breaks down.
- E-commerce treats website visitors as opportunities because purchase friction remains low.
- B2B sales treat sales-qualified leads as opportunities because filtering happens before a deal becomes realistic.
- Dividing B2B deals by total website visitors understates performance.
- Dividing ecommerce purchases by only cart starters overstates performance.
Accurate conversion analysis depends on aligning opportunity definition with buyer behavior so conversion reflects real performance rather than inflated or deflated optics.
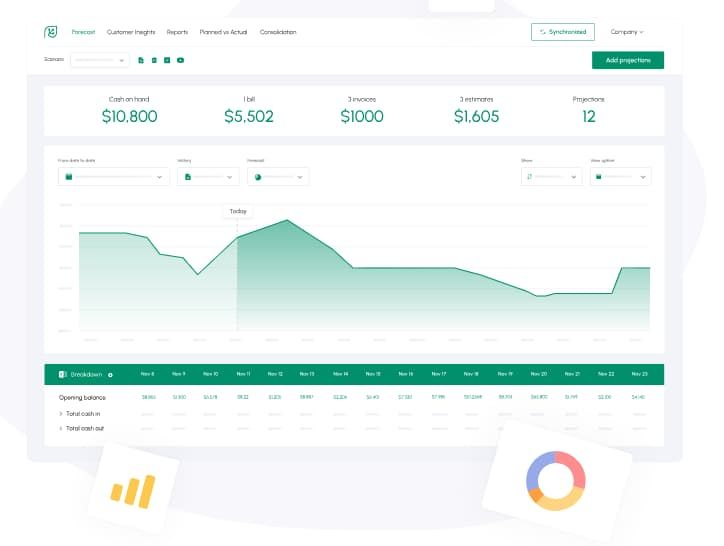
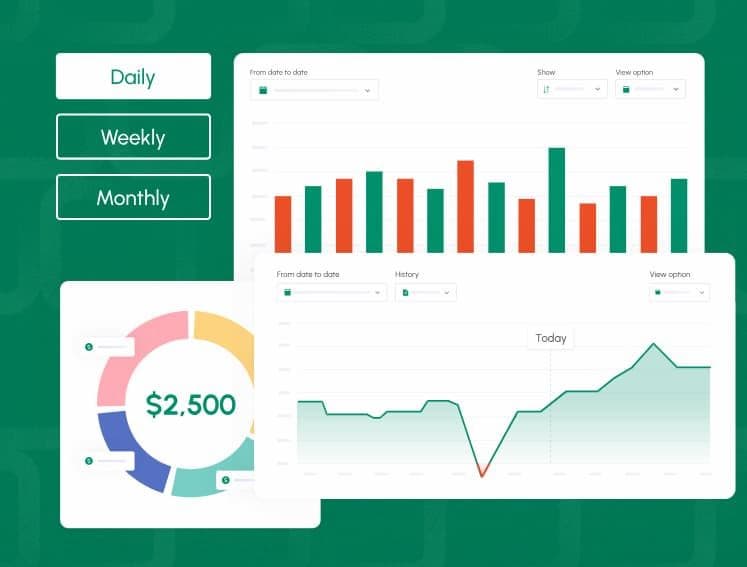
Image: Business cash flow forecast dashboard on Cash Flow Frog | source: cashflowfrog.com
Tracking micro-conversions vs. macro-conversions
Not every conversion puts money in the bank. Some simply tell you whether things are moving in the right direction.
Macro-conversions mark the moment revenue is created. A deal closes. A subscription becomes paid. A customer completes checkout. These are the outcomes finance teams care about because they directly affect revenue.
Micro-conversions happen earlier. An email gets opened. A guide is downloaded. A demo is booked. A proposal is viewed. A free trial begins. None of these actions generates revenue on its own, but each one shows intent building.
Looking at only the final outcome hides useful signals. A SaaS company may notice that demo bookings stay consistent month over month while paid signups quietly slip. That pattern rarely points to poor lead quality. More often, it suggests friction later in the process. Pricing may feel unclear. Onboarding may create hesitation. Product value may not be obvious quickly enough.
| Funnel Stage | Example Action | Insight Provided |
|---|---|---|
| Micro-conversion | Demo scheduled | Interest confirmed |
| Micro-conversion | Trial activated | Evaluation underway |
| Macro-conversion | Paid subscription | Revenue generated |
When both micro and macro conversions are tracked together, teams can see where momentum slows instead of guessing. That visibility makes it possible to fix the right problem before revenue takes the hit.
Know what a reasonable sales conversion rate is before it shows up in missed cash targets.
Try cash flow forecastingWhat is a good conversion rate in sales?
Once the sales conversion rate definition is clear, the next question becomes what a good conversion rate looks like in practice. Strong sales conversion rates depend on industry dynamics, price point, and buying risk.
Across most industries, website conversion rates average 2 percent to 5 percent and serve as context, not targets.
Even small increases, such as 2.6 percent to 3.4 percent, raise revenue without more traffic. Conversion rate is most useful when tracked over time, not against averages alone.
Industry-specific benchmarks for 2026
Conversion rates vary significantly across industries because buyer behavior differs.
| Industry | Typical Conversion Range |
|---|---|
| Agriculture and e-commerce | 0.6 percent to 1.4 percent |
| Fashion and accessories | 1.0 percent to 2.2 percent |
| Health and well-being | 1.9 percent to 4.2 percent |
| Arts and crafts | 3.8 percent to 4.1 percent |
| Food and drink | 1.0 percent to 2.0 percent |
A niche artisan brand often converts higher because buyers arrive with a specific intent. An industrial supplier converts lower because purchasing decisions require technical validation and internal approvals. Benchmarks only offer context when business models align.
High-ticket vs. Low-ticket sales cycles
High-ticket sales convert fewer prospects because decisions involve multiple stakeholders, longer timelines, and greater perceived risk. Enterprise software contracts often convert below 10 percent.
Low-ticket sales convert more quickly. A $40 purchase typically requires minimal evaluation. Conversion rates rise accordingly.
Revenue impact depends on deal size. One additional enterprise contract may generate more revenue than hundreds of small transactions. This relationship explains why enterprise sales teams closely monitor even small shifts in conversion rates.
Why your business lives or dies by this metric
Conversion rate multiplies every growth initiative. Marketing spend becomes more efficient. Sales capacity produces more revenue. Content investments deliver higher returns.
Low conversion quietly increases customer acquisition cost. Teams chase volume to compensate. Workload rises. Forecast reliability declines. Conversion rate often reveals internal misalignment before revenue reports surface the issue.
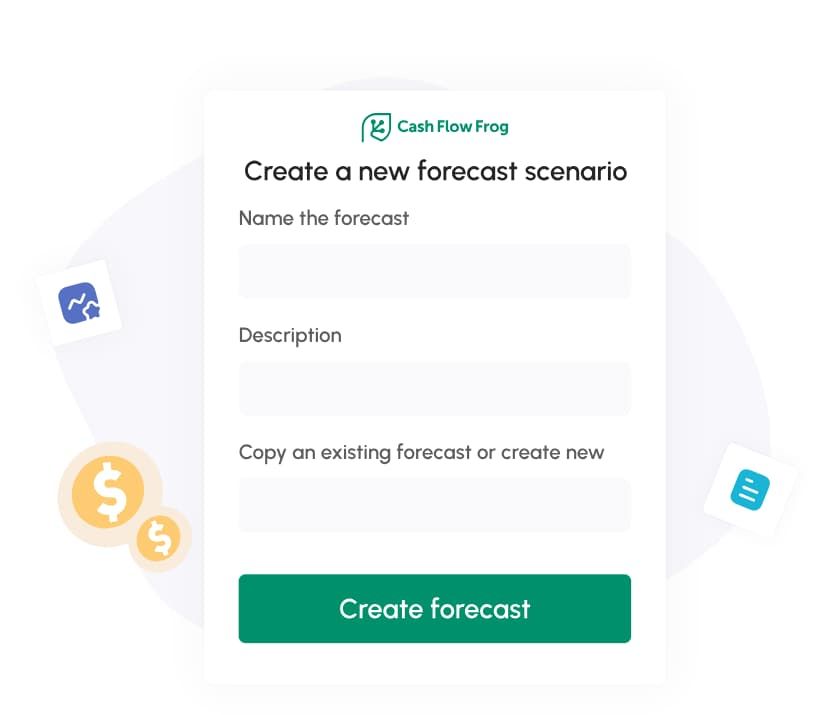
Image: Forecast scenario feature on Cash Flow Frog | source: cashflowfrog.com
The Financial Ripple Effect: How conversion impacts your Cash Flow
Revenue recognition occurs when deals close. Cash arrives later. Sales conversion rates directly affect both the speed and predictability of cash inflows. Higher conversion shortens sales cycles. Buyers commit faster. Fewer deals stall. Cash inflows stabilize.
Lower conversion introduces volatility. Forecasts miss targets. Hiring plans pause. Marketing strategies shift reactively.
Shortening the Gap between "Closed-Won" and "Cash-in-Bank"
A closed deal does not guarantee immediate payment. Contract negotiations, procurement reviews, and invoicing delays slow cash collection.
Consider 2 consulting firms that each close $750,000 in contracts during a quarter. One qualifies for budget authority and payment terms early and collects within 30 days. The other closes deals with mid-level managers and waits 90 days. Both firms show equal revenue, yet their cash positions differ dramatically.
Predictable Revenue: Using conversion data for financial stability
Stable conversion rates support accurate planning. Finance teams forecast with fewer surprises. Sales leaders commit to targets responsibly.
Rolling averages reduce volatility, while segment-level conversion data sharpens projections. Cash planning improves when assumptions rely on observed behavior rather than optimistic projections.
Common leaks in the sales funnel (and how to plug them)
Leaks appear where momentum slows. Weak qualification, delayed follow-up, and inconsistent messaging reduce downstream conversions.
Adding more leads rarely solves these issues. Higher volume often lowers average lead quality and worsens conversion. Addressing leaks delivers stronger returns.
The ghosting phenomenon: Re-engaging silent leads
Prospects disengage for practical reasons. Priorities change. Timing shifts. Information overload increases.
Re-engagement works when outreach adds relevance. A concise message referencing a specific business challenge discussed earlier performs better than repeated generic follow-ups.
Fix the handoff: Smoothing the transition from Marketing to Sales
Misaligned handoffs disrupt momentum. Marketing celebrates lead volume. Sales struggles with fit.
Shared definitions reduce friction. Feedback loops improve targeting. Conversion rises when both teams share responsibility for outcomes.
Advanced segmentation: Looking beyond the total percentage
Overall conversion masks meaningful differences. Segmentation reveals them.
Channel-level conversion shows where intent concentrates. Persona-level data highlights fit. Deal-size segmentation exposes profitability. Cohort analysis tracks performance over time and uncovers patterns that averages hide.
Tools of the trade: From CRM to Cash Flow Forecasting
Conversion tracking requires accurate data. CRMs centralize activity and opportunity history. Analytics platforms connect behavior to outcomes.
Cash flow software translates conversions into cash timelines. Integrated systems reduce blind spots and support informed planning decisions.
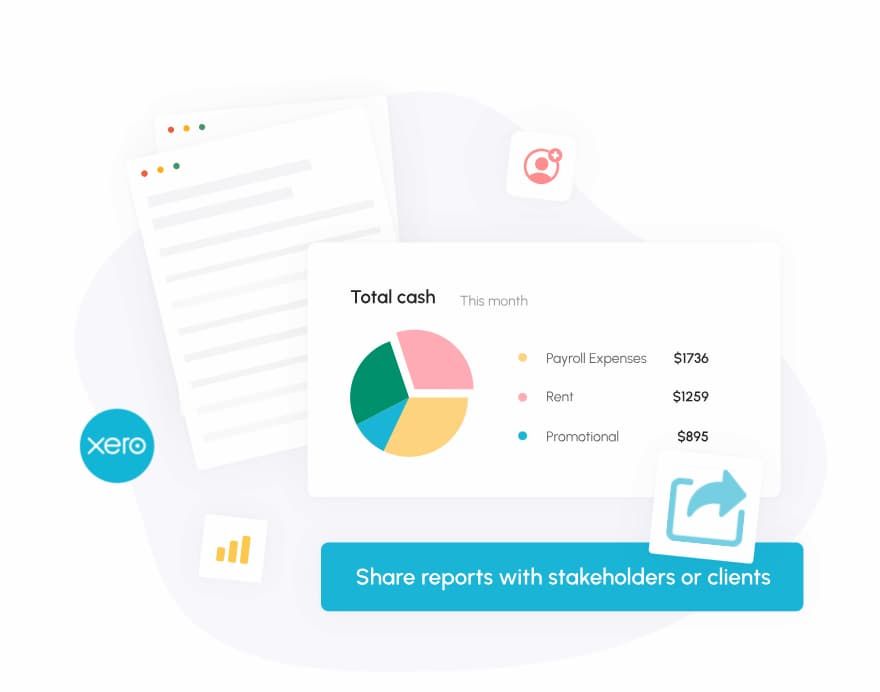
Image: CashFlow Frog report and sharing feature | source: cashflowfrog.com
The role of Sales Enablement in boosting rates
Enablement supports consistent execution. Sales teams access relevant material at the right moment. Buyers receive clear, timely answers.
Personalized resources accelerate decisions. Generic content slows progress. Conversion improves when clarity replaces confusion.
How to perform a Sales Conversion Audit
A conversion audit begins with definitions. Teams must clarify what qualifies as a conversion and what counts as an opportunity.
The next step involves mapping the process. Each stage, handoff, and delay should be documented and reviewed.
| Audit Area | Diagnostic Question |
|---|---|
| Qualification | Do leads meet buying criteria |
| Follow-up | How quickly does outreach occur |
| Stage drop-off | Where do prospects exit |
| Payment | How long until cash arrives |
Future Trends: AI and the Evolution of Sales Conversion
Connect conversion performance to real cash movement. Explore Xero integration with Cashflow Frog.
Explore Xero integrationAI improves lead scoring, timing, and personalization. Predictive models identify likely outcomes earlier. Sales teams focus their efforts where the probability is highest.
Automation reduces manual work. Oversight remains necessary. Data quality determines accuracy. Human judgment continues guiding decisions.
Common mistakes that artificially inflate (or deflate) your numbers
Counting unqualified leads as opportunities inflates conversion. Mixing timeframes hides trends. Ignoring payment delays distorts cash forecasts.
Optimizing conversion without tracking revenue quality produces misleading results. Percentages matter less than sustainable profit.
Summary: Turning metrics into momentum
Sales conversion rates show how growth actually occurs across teams, channels, and timeframes. It connects effort to outcome. Small improvements compound across teams, budgets, and planning cycles.
Connect conversion performance to real cash movement. Explore Xero integration with Cashflow Frog.
Explore Xero integrationRelated Terms
FAQ
Looking for more help?
Visit our help center to find answers to your questions about CashFlowFrog.
Trusted by thousands of business owners
Start Free Trial Now