Interest Coverage Ratio: Formula, Examples, and How to Interpret It

What is interest coverage ratio, and why does it feel like an afterthought until cash runs thin? Many business owners hit that moment. Sales stay strong. Invoices flow. The books look fine.
Yet every month, the weight of loan payments and the growing interest burden tightens. Stress rises. The numbers miss something. That “something” often hides in the interest coverage ratio, the measure that shows how well your real earnings handle the cost of your debt.
What Is the Interest Coverage Ratio?
The interest coverage ratio measures whether a business can handle its debt comfortably using operating profit. It asks one question. Can the money made from regular operations pay interest without creating strain?
To understand what is ICR in practical terms, you compare operating earnings, EBIT, to the interest owed in the same period. The ratio shows how many times those earnings could cover the interest.
When the result is high, debt feels manageable. When it falls too low, even strong sales cannot prevent a squeeze. That is why many owners treat ICR like an early warning system. Once you grasp the interest coverage ratio meaning, you can spot pressure long before a cash crunch appears.
Some people refer to it as the times interest earned ratio. Both terms mean the same thing. They look at how many times operating profit can cover interest payments. That focus helps owners stay ahead of financial trouble.
Ready to get clarity on ICR meaning and strengthen your financial decisions?
Sign up todayWhy the Interest Coverage Ratio Matters for Business Survival
Debt payments remain due whether revenue is up or down. They do not adjust for client delays or seasonal dips. When interest begins to eat too much of your monthly earnings, other parts of the business lose funding.
Money that once paid for hiring, advertising, maintenance, or backup inventory now disappears into servicing loans. It feels like the business is working harder but moving more slowly.
Owners describe this as tightening. Not all at once, but month by month. Even when the business books show a profit, that profit does not move the business forward. Over time, growth slows. The ability to act quickly disappears.
The interest coverage ratio helps you:
- Spot risk that hides behind rising revenue
- Know when interest limits flexibility
- Understand how exposed you are if interest rates rise
- Predict how lenders view your company
- Make proactive financial decisions instead of reactive ones
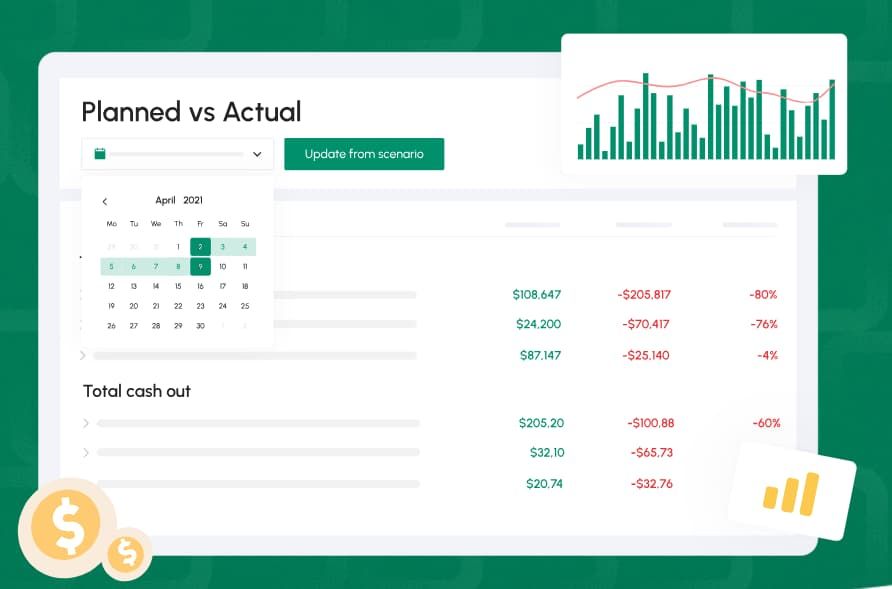
Image: Planned vs Actual budget data displayed on Cash Flow Frog dashboard | source: cashflowfrog.com
How Do You Calculate the Interest Coverage Ratio
The ICR formula uses simple math, but effective coverage ratio analysis depends on whether you want to focus on accounting profit or cash availability.
The Standard Interest Coverage Ratio Formula
To fully grasp ICR's meaning, start with the traditional interest coverage ratio formula, which uses EBIT. EBIT stands for earnings before interest and taxes. It is your profit from normal operations before subtracting financing costs or tax obligations.
ICR formula = EBIT divided by Interest Expense
EBIT focuses only on core performance, making it useful for any interest expense ratio calculation that measures how debt costs affect operating strength.
There are also other ways on how to calculate the interest coverage ratio, including:
- EBITDA divided by Interest Expense
- (EBITDA minus Capital Expenditures) divided by Interest Expense
When exploring how to find the interest coverage ratio, EBITDA becomes helpful because it adds back depreciation and amortization. These are non-cash accounting costs. They reduce profit on paper, but not in your bank account.
Subtracting capital expenditures (CapEx) gives a more conservative view. It shows how much cash is truly left after the business reinvests in itself.
| Ratio Type | Interest Coverage Ratio Formula | Focus |
|---|---|---|
| Standard ICR | EBIT ÷ Interest Expense | Core profit before financing |
| EBITDA ICR | EBITDA ÷ Interest Expense | Operational cash before reinvestment |
| Adjusted ICR | (EBITDA - CapEx) ÷ Interest Expense | Cash left after major reinvestments |
Step-by-Step Example Using Realistic Numbers
To see what is interest coverage ratio in action, say your business earned $10 million last year. Now look at expenses:
- Cost of goods sold: $500,000
- Salaries: $120,000
- Rent: $500,000
- Utilities: $200,000
- Depreciation: $100,000
- Annual interest expense: $3,000,000
How to calculate the interest coverage ratio:
Start with revenue. Subtract direct and operating costs, excluding interest and taxes.
EBIT = 10,000,000 - (500,000 + 120,000 + 500,000 + 200,000 + 100,000) = $8,580,000
Now divide by the interest expense.
ICR = 8,580,000 ÷ 3,000,000 = 2.86
This result means your earnings covered interest payments 2.86 times. There is breathing room, but not a huge buffer. If interest rates rise or a contract falls through, that margin shrinks fast.
See how our tools simplify the interest coverage ratio definition so you can act with confidence.
Read more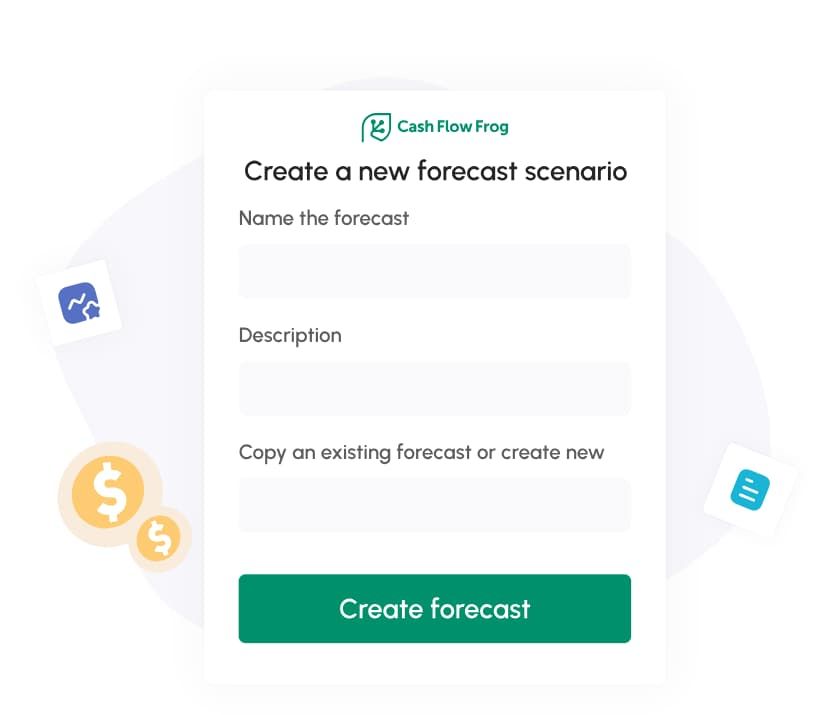
Image: Forecast scenario feature on Cash Flow Frog | source: cashflowfrog.com
Is a Higher or Lower Interest Coverage Ratio Better?
When interest starts absorbing more of your operating strength, even small setbacks hit harder: a delayed payment, a slow sales month, a cost spike. The interest coverage ratio shows how exposed you are to those shocks.
A higher figure means your earnings can absorb stress; a lower one means you’re running closer to the edge than your revenue suggests.
Why Higher Typically Signals Lower Financial Risk
A high ratio brings relief. It gives the business room to move. You can handle slower months, late payers, or even a loan renewal without panic.
Stronger coverage brings:
- Flexibility to make investments without missing payments
- Better interest rates from lenders
- Fewer surprises when projections fall short
- More confident planning
It does not mean the business is flawless. It means current income can support the cost of borrowing.
When a Very High Ratio Is Not Always a Good Sign
If your ICR is extremely high, it could mean you are underusing debt. Businesses that avoid borrowing completely may miss useful growth opportunities.
Responsible debt helps fund:
- Hiring that drives revenue
- Equipment that increases productivity
- Location expansion to meet demand
- Larger inventory for faster delivery
Very high ratios can show too much caution. That slows growth, even when capital is available.
Why a Low Ratio Is One of the Most Serious Red Flags
A low interest coverage ratio means pressure. Earnings barely cover loan costs. If anything shifts, from sales to expenses, the business struggles to keep up.
When ICR slips under 1.5:
- Every late payment causes worry
- Owners may need to cut spending fast
- Lenders grow hesitant about future credit
- Personal guarantees feel riskier
Drop below 1.0 and the math no longer works. Earnings cannot cover interest. It becomes a question of how long the business can stay open.
What the Interest Coverage Ratio Says About Your Business Health
ICR does not tell a full story by itself, but evaluating what is a good interest coverage ratio for your industry is helps clarify how well your operational earnings hold up under debt. That becomes useful when:
- Sales grow, but ICR falls. Your debt or cost structure may be eating the gains.
- Income holds steady while ICR declines. Rising debt is likely pulling cash away.
- ICR drops even though cash flow looks good. CapEx or deferred costs may be catching up.
Track it monthly or quarterly. That shows if conditions change before the annual review.
Industry Benchmarks: What Counts as a Good Interest Coverage Ratio
Different businesses run on different margins. A trucking company carries more fixed costs than a software firm, so what counts as a good interest coverage ratio shifts by industry.
| Industry | Target ICR |
|---|---|
| Manufacturing | 3.0 and higher |
| Logistics and Distribution | 3.0 and higher |
| Construction | 2.5 to 3.0 |
| Retail | 2.0 minimum |
| Restaurants | 2.0 minimum |
| Tech / SaaS | Around 2.0 |
| Real Estate (BTL loans) | 1.25 to 1.45 (DSCR style) |
Use industry benchmarks as guides, because understanding the interest coverage ratio meaning varies depending on cash cycle, margins, and debt structure.
Manufacturing companies deal with high fixed costs from machinery, raw materials, and labor. These costs stay constant even when sales drop. An interest coverage ratio of 3.0 or higher helps ensure the business can cover interest without falling behind during slow periods or cost spikes.
Logistics and distribution firms face similar cost structures. Fuel, vehicle maintenance, and driver wages create a steady cash burden. Because of thin timing margins and rising operational costs, a ratio above 3.0 is often needed to protect against payment delays or unexpected expenses.
Construction companies experience uneven cash flow. Projects can stall, and payments are often delayed until milestones are met. These gaps make it risky to rely on tight earnings. A target ICR between 2.5 and 3.0 helps absorb timing issues without missing debt payments.
Retail businesses operate with slim margins and constant expenses. Rent, payroll, and inventory costs do not wait for seasonal dips to pass. A minimum ICR of 2.0 offers just enough cushion to handle shortfalls without forcing sudden cuts or supplier delays.
Restaurants face even tighter margins than retail. Daily sales swings, staffing costs, and perishable inventory make them vulnerable to small disruptions. Maintaining a ratio of at least 2.0 helps cover interest and avoid cash shortages when business slows.
Tech and SaaS firms often run lean operations with high margins but heavy reinvestment. Spending on development, sales, and support can lower earnings despite strong revenue. An ICR around 2.0 reflects stable interest coverage while still allowing growth investment.
Real estate companies that hold rental properties use DSCR-style metrics. These lenders expect net income to cover 125 to 145 percent of total debt payments. That translates to an ICR-style benchmark in the 1.25 to 1.45 range, depending on risk and property type.
Interest Coverage Ratio vs Debt Service Coverage Ratio (DSCR)
When comparing interest coverage vs DSCR, it becomes clear why tracking only interest coverage can give a false sense of security. ICR reacts quickly to revenue swings, while DSCR tests whether the entire repayment schedule is manageable. When combined, they create a more complete view of your debt capacity and your true level of risk.
How They Complement Each Other
ICR calculation only tracks interest. DSCR goes deeper. It includes both interest and principal repayments.
Key comparisons:
- ICR reflects how well operations support interest
- DSCR reflects the ability to repay full loan obligations
- ICR moves quickly with revenue swings
- DSCR gives a full view of long-term affordability
Owners using both ratios get better insight. ICR spots rising pressure. DSCR confirms full debt sustainability.
Limitations of the Interest Coverage Ratio
No single ratio works in isolation. ICR cannot:
- Reflect the timing of cash payments
- Track changes in principal repayment terms
- Adjust for seasonality swings
- Account for working capital strain
- Show exposure to floating interest rates
It gives one angle. Combine it with cash flow tracking and DSCR to see the full picture.
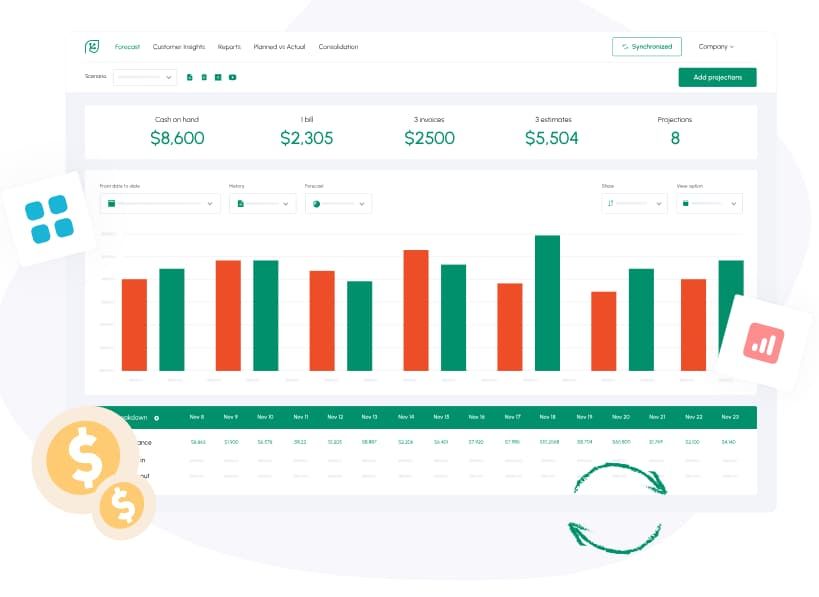
Image: Forecast dashboard on CashFlow Frog | source: cashflowfrog.com
Interest Coverage Ratio and Cash Flow Forecasting
Debt problems rarely appear overnight. They build quietly as cash timing changes and interest obligations compound. Linking your ICR to projected cash flow exposes those patterns early and shows exactly when debt will begin to limit your options.
Predicting Future Debt Pressure
Project ICR forward one to three years. Use conservative revenue assumptions. Include possible cost increases. Factor in rate changes.
This shows when your ability to cover interest might fall below comfort. That is when you act, not react.
Identifying Liquidity Gaps Before They Become Critical
Timing matters. A business may look profitable on paper but still run out of cash if collections fall behind.
Cash flow forecasting helps identify:
- Seasonal slowdowns that squeeze liquidity
- Delays in accounts receivable
- Overlapping loan payments
- Unexpected large purchases
Compare cash timing with interest due dates. Then use ICR to see if operational income can bridge the gap.
Common Mistakes When Using the Interest Coverage Ratio
Owners sometimes:
- Focus on annual results instead of monthly data
- Use EBIT when cash is tighter than earnings suggest
- Ignore principal payments and upcoming loan renewals
- Assume a good year will continue unchanged
- Compare against unrelated industries
Avoid shortcuts. Use ICR with context. Check it regularly.
Summary: Why the Interest Coverage Ratio Is Essential for Financial Planning
Understanding ICR's meaning helps you see how much strain your debt puts on real earnings. It tells you whether current operations can carry financing costs. It flags when growth adds pressure instead of strength.
By using cash flow software, owners can get clear, timely insight into whether borrowing supports the business or holds it back. That information leads to better decisions.
Try CashFlow Frog today to fully understand what is ICR and how it shapes your borrowing flexibility as you grow.
Read moreRelated Terms
FAQ
Looking for more help?
Visit our help center to find answers to your questions about CashFlowFrog.
Trusted by thousands of business owners
Start Free Trial Now