What Is Gross Profit? A Clear Guide with Examples

What does gross profit mean when revenue looks strong, but cash still feels tight? It is the first real test of whether your pricing and direct costs are working together. A business can grow sales and still weaken its economics if contribution erodes quietly. In this guide, we answer the question “what is gross profit?” explain how to calculate it, and show how to apply it to pricing and cost decisions.
Gross Profit Definition in Plain English
This figure represents the money left after paying the direct costs required to deliver what you sold. It sits near the top of the income statement for a reason. It tells you whether the core offer carries its own weight before overhead enters the picture.
The definition of gross profit is revenue minus cost of goods sold. The meaning of gross profit remains reliable only when you classify costs the same way each month. If you shift expenses in or out of cost of goods sold, the trend becomes misleading.
A practical way to think about it is contribution. In management accounting, contribution refers to the amount left after direct costs are covered. That remainder helps pay fixed operating expenses such as rent, payroll, tools, insurance, and growth investments.
How Do You Calculate Gross Profit?
Be consistent in your categories. You must have a clear definition of what cost of sales means and apply it in the same way every month. If you reclassify direct costs, you would lose comparability.
Gross Profit Formula: Revenue − COGS
The formula for gross profit is revenue minus costs of goods sold. If revenue equals 120,000 and costs of goods sold are 70,000, then the result is 50,000.
What counts as COGS (and what doesn’t)
Cost of goods sold, also known as cost of sales, is the direct cost that rises with each sale you make or with each product you produce.
Typical COGS items include:
- Materials and inventory consumed
- Direct labor that produces the item or delivers the service
- Packaging and inbound freight
- Production supplies and subcontractors used on client work
Costs that usually do not belong in COGS include:
- Office rent, administrative salaries, and general insurance
- Marketing, advertising, and sales tools
- Accounting, legal, and banking charges
- Software used across the company rather than for delivery
Apply this rule of thumb. Costs that continue even when sales stop are typically operating expenses, not direct costs tied to production or delivery.
Gross Profit Example with Real Numbers
Examples make the calculation practical. The goal is not to commit the formula to memory but to grasp which variables are most important to your outcome.
A simple monthly example
With 85,000 in revenue and 52,000 in expenses, a small retailer will have 33,000 left over to pay for operating costs like rent, salaries, utilities, and marketing.
Let's now assume that supplier prices increase by five percent. As a result, the initial direct costs of 52,000 are increased to 54,600. The remaining contribution goes down by 2,600.
If the original margin over operating expenses was only 3,000, that cost increase nearly eliminates the cushion for the month.
This gross profit example illustrates how sensitive results can be to relatively small changes in direct costs. Even during a strong sales period, rising input prices can quickly compress margins.
Another gross profit example is a café operating with a thin contribution per sale. A small increase in the cost of ingredients, spoilage, or waste can wipe out the profit that covers the cost of rent and labor. Thin margins on sales cannot be made up by increased sales volume.
A product vs service example
A product company sells goods. A service company sells time and expertise. Although they have different cost drivers, both can be profitable.
Let's say they each earn 300,000.
Product business example:
- Revenue: 300,000
- Cost of sales: 210,000
- Gross profit: 90,000
- Gross margin: 30 percent
Product businesses have to deal with inventory, sales prices, shipping, and returns. Physical goods create ongoing material and logistics costs that typically keep margins tighter.
Service business example:
- Revenue: 300,000
- Direct delivery labor: 150,000
- Gross profit: 150,000
- Gross margin: 50 percent
Service businesses often show higher margins because they do not carry inventory. Their constraint is capacity. If utilization drops or labor hours increase, margins compress quickly.
Why Gross Profit Matters More Than People Think

“Black Calculator Near Ballpoint Pen on White Printed Paper.” – Image | Pexels
It is easy to focus on revenue targets. The risk is that sales can increase while margins quietly weaken. Without a clear view of contribution, growth can create pressure instead of stability.
The gross profit, meaning in business, is simple. It shows whether the core offer generates enough contribution to support operating expenses and future investment.
It shows pricing power and cost control
When the trend is steady or improving, two things are usually happening. Pricing is holding firm, and direct costs are being managed with discipline.
When the trend declines, look for common causes:
- Discounting that becomes routine rather than strategic
- Input cost increases that are not reflected in pricing
- Extra labor hours are required to deliver the same output
- Returns, waste, and rework
If you sell multiple products or packages, review performance by line item. A blended percentage can hide the fact that one offer carries the business while another generates activity with little contribution.
Tracking gross profit in business by product line or client segment reinforces the meaning of gross profit and helps identify where discounts and delivery hours are quietly reducing margin.
It’s the fuel for operating expenses and growth
This is where the metric has a real-world application. It pays for rent, salaries, software licenses, and the individuals who keep the business up and running. It also pays for growth, such as marketing tests, hiring new people, and improving systems.
If you are asking, “Why is gross profit important for businesses?”, the reason is structural. Gross profit must absorb operating costs and still support growth and uncertainty.
To connect contributions to planning, track changes in gross profit month over month, and pair those results with cash flow forecasting to model the cash impact.
For product companies, working capital introduces a new dimension. If the inventory buildup is ahead of sales or if payments from suppliers accelerate, cash challenges could intensify even if margins look more or less stable. Watching both contributions and timing helps prevent surprises.
Gross Profit vs Gross Margin
Gross profit is the amount left after subtracting the cost of sales. Gross margin is the percentage of gross profit out of total revenue.
When revenue is 100,000, and gross profit is 40,000, gross margin is 40 percent.
The amount indicates how much remains to be paid toward operating expenses. The percentage is useful for comparing different months when sales vary.
What Is the Difference Between Net and Gross?
Gross profit is calculated by deducting only the cost of sales. Net profit also deducts operating expenses, interest, and taxes.
If gross margins are low, the problem is likely in pricing, product, or cost of sales. If gross profit is high but net income is low, the problem is in overhead.
What’s a “Good” Gross Profit?
A “good” result is relative to your delivery model. Retailers, manufacturers, agencies, and software companies face fundamentally different cost structures.
Why “good” depends on industry and business model
Cost structures vary widely by industry. Retailers, manufacturers, agencies, and software companies face different labor intensity, inventory costs, and pricing constraints. Because input costs move differently across sectors, a “good” margin in one industry may be unsustainable in another.
Better benchmark: your own trend + peers
Begin with your own data. Calculate your gross margin percentage every month for a period of at least one year. This will give you a basis of comparison. Next, compare your data with similar businesses that have the same delivery model and sales channel mix.
In addition, break down your data by sales channel. Internet sales, for example, have higher shipping costs and returns.
Wholesale operations tend to have more constricted prices and margins. This is something blended numbers might not reflect.
A persistent gross margin decline is a warning sign to take action. Margin pressure does not improve on its own.
The definition of gross profit becomes more practical when you monitor the trend over several quarters rather than focusing on a single month.
What Can Push Gross Profit Down
Margin pressure usually builds gradually, not all at once.
Common causes include:
- Supplier price increases without pricing updates
- Discounting that expands from promotions into daily practice
- Freight, packaging, and damage costs
- Waste, scrap, and inefficient setups
- Returns and warranty claims
- Product mix shifting toward lower margin items
A helpful approach is to focus on the three biggest cost drivers and monitor them every month. If any of these cost drivers, whether it’s materials, labor hours, or returns, start to rise, it can quickly alter the profitability outlook.
How to Improve Gross Profit Without Killing Sales

“Hands Holding US Dollar Bills.” – Image | Pexels
Most of the time, the way to improve gross profit is through a series of small, focused actions, not big increases in prices or costs.
Pricing moves that don’t scare customers
Start with moves that keep trust intact:
- Remove blanket discounts and require a reason for exceptions
- Offer bundles that increase average order value without reducing perceived value
- Increase prices on services that customers are least sensitive to, such as add-ons, premium services, or urgent turnaround services
- Be transparent about deliverables to help customers understand what they're getting for their money
Test your changes on a small segment of customers. Measure conversion rate, support requests, and return rate.
Reduce COGS with process and supplier work
Direct costs can be cut without reducing quality by:
- Renegotiating with suppliers based on volume reliability and payment terms
- Standardizing steps so labor hours do not drift upward
- Improving forecasting so you buy inventory at better intervals
- Reviewing packaging and shipping methods to reduce damage and returns
- Using checklists for quality control on repeatable work
Fix leakage: returns, waste, rework
Rework and returns lower margins. Keep track of returns by product and reason, then start by resolving the most common problems. Reinforcement may be required for packaging. Instructions might require explanation. Costly redo work can be avoided with a quick quality check.
Leakage frequently manifests as scope creep and unpaid revisions in service-oriented businesses. Improve your admissions procedure, specify what is included up front, and provide clear pricing for any additional requests.
Common Gross Profit Mistakes
Most gross profit mistakes are not complex. They usually stem from small reporting habits or overlooked patterns that distort the real picture.
Common issues include:
- Mixing overhead into the cost of sales and hiding the real cause
- Relying on a blended percentage and missing product-level problems
- Looking at one month in isolation and missing seasonality
- Chasing revenue while the economics weaken
- Cutting costs that increase returns, defects, or support work
Review the balance sheet alongside the income statement. Profitability and liquidity are not the same. Inventory and receivables within Current Assets can restrict cash, while Current Liabilities control when payments are due.
Summary: Gross Profit at a Glance
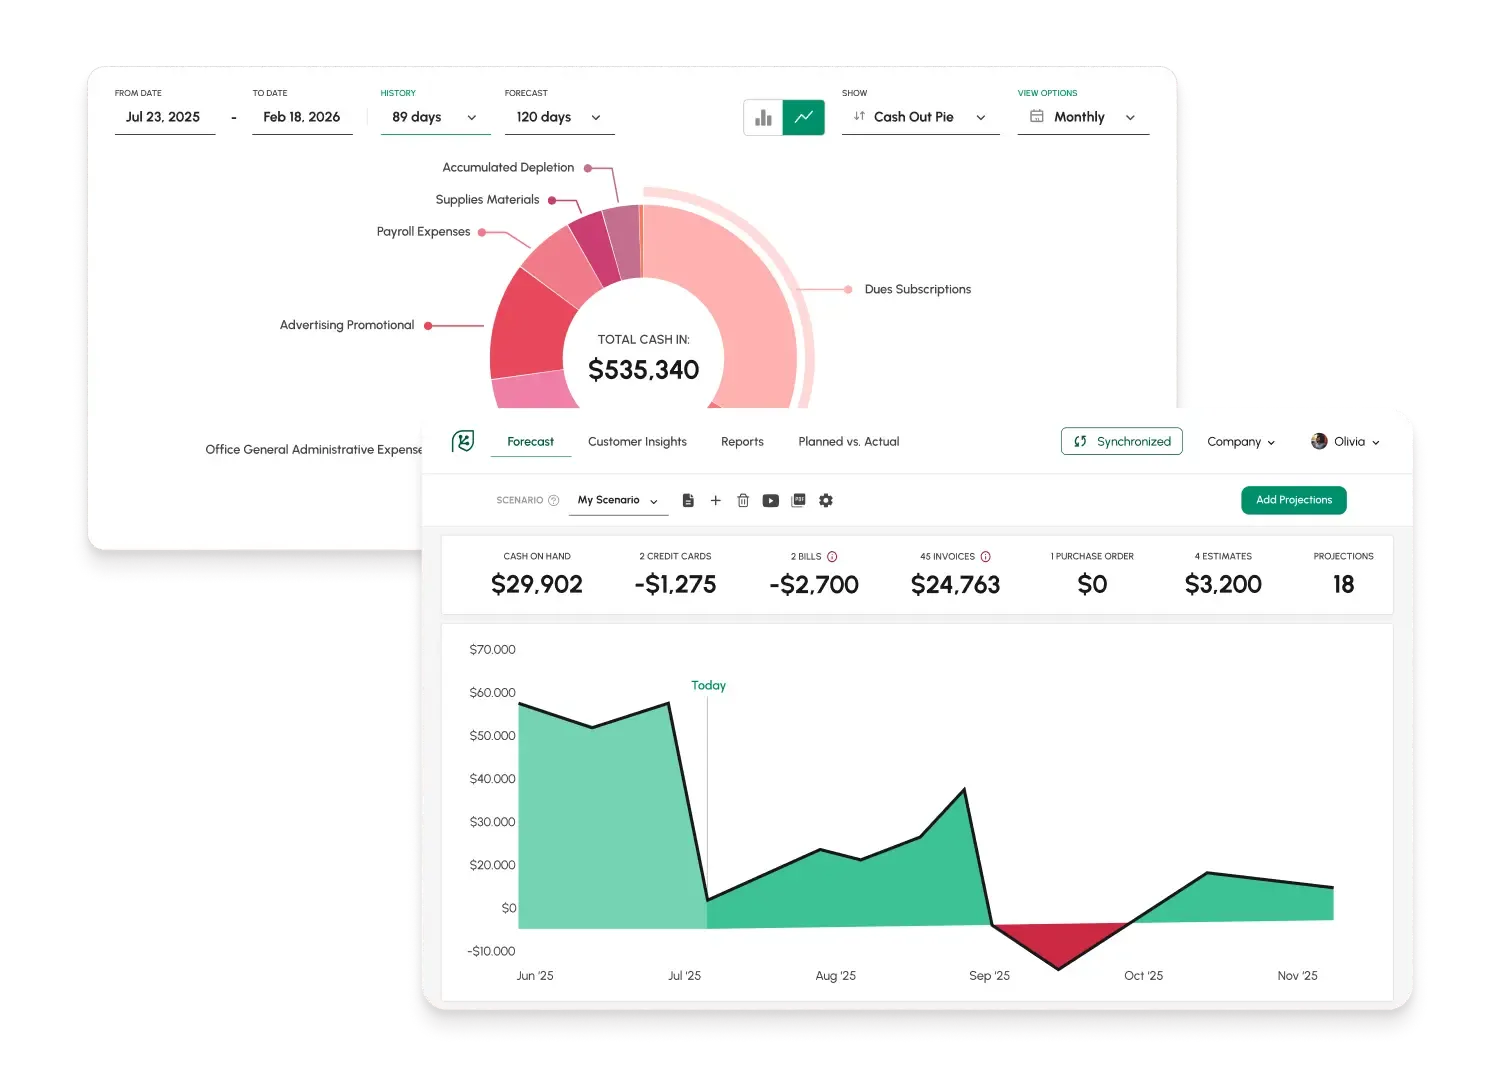
“Cash Flow Frog integrations.” – Image | Cash Flow Frog
The definition of gross profit is the amount remaining after direct delivery costs are deducted from revenue. It is one of the clearest indicators of whether pricing and delivery are working as intended.
Use gross profit effectively by following three practices:
- Track the dollars and the percentage monthly
- Break results down by product line, package, or channel
- Pair the trend with cash flow forecasting so timing and working capital are visible
Ready to connect your margin insights to structured planning?
Explore Cash Flow Frog features to model pricing changes and working capital impact
Explore Cash Flow FrogRelated Terms
FAQ
Looking for more help?
Visit our help center to find answers to your questions about CashFlowFrog.
Trusted by thousands of business owners
Start Free Trial Now