Asset Turnover
Asset Turnover Explained: Formula, Examples, and Why It Matters

Every company owns assets, but not every company makes them work hard enough. The asset turnover ratio demonstrates how efficiently your business uses its resources to generate income. It brings light to what is actually going on behind the scenes, whether it is idle machinery or inventory sitting around gathering dust.
By understanding this ratio, you can determine how each peso or dollar you invest is used to drive the company's growth, cash flow, and overall strength over time.
What Is Asset Turnover?
To understand what is asset turnover, think of it as a measure of how efficiently your company converts its resources into sales. It’s one of the key efficiency ratios that reveal how well management turns investment into output.
To put it simply, the higher the ratio, the more your assets are working for you. And the lower the ratio is, the less your inventory is working as hard, or it could be slow-moving.
The asset turnover ratio over time is a good way to determine whether you are growing due to improved productivity or by adding more assets.
How to Calculate Asset Turnover Step-by-Step

Photo: Calculating the asset turnover formula with real financial data - Freepik
The asset turnover formula divides net sales by average total assets. It represents how many times a company’s assets are “turned over” during a period to generate sales. This supports the asset turnover ratio definition by showing how efficiently a business converts its asset base into revenue.
Using beginning/ending assets to get the average
To calculate asset turnover, take your total assets at the beginning and end of the period, add them, and divide by 2. That number is your average total assets.
Formula:
Average Total Assets = (Beginning Assets + Ending Assets) ÷ 2
Using this approach helps even out changes from asset purchases or sales during the year, giving you a more accurate picture of performance.
Which “sales” to use: gross vs. net
When applying the asset turnover formula, always use net sales, not gross. Net sales eliminate returns, discounts, and allowances to give you a more accurate view of your actual income. Gross sales may also present a figure that can mislead a conclusion about efficiency, because they may be overstated.
Key Tip: Always reconcile net sales to average total assets for the same period to maintain accurate records.
Worked example with simple numbers
Let’s put the asset turnover ratio formula into practice. Think of your company that earns $400,000 in net sales and holds $200,000 in average total assets.
Calculation:
Asset Turnover = Net Sales ÷ Average Total Assets
Asset Turnover = 400,000 ÷ 200,000 = 2.0
That means your business makes $2 in sales for every $1 it invests in assets. This asset turnover ratio calculation example demonstrates how the ratio quantifies operational performance in a single, easy-to-read figure.
| Component | Amount (USD) | Explanation |
|---|---|---|
| Net Sales | 400,000 | Total annual revenue |
| Average Total | 200,000 | Mean of beginning and ending asset values |
| Asset Turnover | 2.0 | Sales generated per $1 of assets |
Interpretation: A ratio of 2.0 indicates strong efficiency, especially in retail or consumer goods sectors where quick asset turnover is common.
Want clearer insight into how your assets affect cash flow?
Start forecasting smarterWhy Asset Turnover Matters
Understanding what is the asset turnover ratio helps you see how every peso of working capital drives real revenue. The asset turnover meaning reflects how efficiently assets turn investment into returns. A rising ratio shows that your assets are working harder, while a drop can warn you of overinvestment or idle equipment waiting to be put to use.
For investors, it offers a measurable view of managerial efficiency. For operators, it highlights the importance of allocating resources day to day and how this influences profits. For instance, a retailer with good logistics can make the same amount of money with half the assets of a slower competitor.
This difference impacts margins and affects cash availability. A high ratio is more than an accounting result. It reflects strategic control over how resources are deployed. Tracking the ratio routinely ensures that assets are generating consistent returns and supports smarter financial planning.
Asset Turnover in the DuPont Framework
In the DuPont model, the asset turnover ratio formula links efficiency directly to profitability. Alongside profit margin and the equity multiplier, it helps you see how your sales and capital decisions shape your overall return on equity. Think of it as a way to trace the source of your performance.
| Component | Formula | Purpose |
|---|---|---|
| Profit Margin | Net Income ÷ Sales | Measures profit from each sale |
| Asset Turnover | Sales ÷ Assets | Gauges the efficiency of asset use |
| Equity Multiplier | Assets ÷ Equity | Evaluates leverage impact |
For instance, two companies with identical profit margins can post very different ROEs if one manages assets more efficiently. The DuPont model makes this relationship visible, helping analysts pinpoint whether low returns stem from sales, cost, or asset deployment.
In scenario planning, small improvements in turnover can meaningfully increase ROE by enhancing each asset's contribution to revenue.
Total Asset Turnover vs. Fixed Asset Turnover
The fixed asset turnover ratio looks at how well your long-term assets, like machinery or property, generate sales. Total asset turnover goes broader, covering both current and fixed assets to show how efficiently your entire operation drives revenue.
To grasp what is asset turnover more broadly, it reflects the productivity of all company resources working together to generate revenue.
Though the asset turnover formula remains consistent, interpretation differs. The asset turnover ratio formula used for fixed assets assesses capital utilization, while the total version reflects overall operational balance.
| Metric | Formula | Focus | Best For |
|---|---|---|---|
| Total Asset Turnover | Net Sales ÷ Total Assets | Overall efficiency | Cross-industry comparison |
| Fixed Asset Turnover | Net Sales ÷ Fixed Assets | Long-term productivity | Capital-intensive sectors |
Manufacturers frequently monitor both to verify whether their equipment is generating adequate revenue relative to cost. At the same time, service-based companies are more concerned with total turnover, since they use fixed assets less frequently. In asset-light models such as SaaS, total turnover carries more insight, since much of their value lies in recurring revenue rather than machinery or plants.
What Is a Good Ratio for Asset Turnover?

Photo: Comparing industry benchmarks to assess a healthy asset turnover ratio - Freepik
There’s no single “good” fixed asset turnover ratio. What is considered efficient depends entirely on your industry and the asset intensity of your operations. Businesses with short cash conversion cycles, for example, retail or e-commerce, may do well above a ratio of 2.0. In contrast, manufacturers with longer cycles may still do well below 1.0 and remain healthy.
To interpret performance effectively:
- Compare against industry norms.
- Review several years of data to track progress in efficiency.
- Consider shifts in asset mix or recent capital additions.
The goal is not just to raise the ratio, but to maintain healthy and sustainable productivity over time.
Common Pitfalls and Window Dressing
Some companies try to make their fixed asset turnover ratio look better than it really is. Common tricks include:
- Recording sales before they’re actually earned to inflate short-term performance.
- Postponing asset purchases or delaying depreciation to reduce reported assets.
- Keeping operating leases off the balance sheet to make efficiency look higher than it truly is.
These window dressing tactics distort the reliability of the ratios. The accountants must verify with the cash flow statement and the depreciation schedules to ensure authenticity.
Such actions could temporarily boost valuation metrics but often result in a loss of investor confidence once discovered, as performance is re-evaluated based on sustainability and efficiency rather than short-term gains.
How to Improve Asset Turnover Without Breaking Things
Improving your fixed asset turnover ratio isn’t about cutting corners. It’s about making the most of what you already have. Smarter use of time, equipment, and people can lift efficiency without reducing quality.
Better utilization & scheduling
You can learn how to find asset turnover opportunities by checking for downtime or scheduling gaps. Every hour your machines sit idle is a missed chance for revenue. Simple adjustments often make a big difference. Aim for:
- Higher production output per machine hour.
- Reduced setup times between production runs.
- Shared equipment across departments.
Small operational improvements can lead to meaningful changes in asset turnover over time.
Inventory and receivables discipline
Keeping tight control of receivables helps your cash stay healthy and predictable. The better you manage collections and inventory, the stronger your cash flow projections become. Key practices include:
- Shortening credit terms where feasible.
- Incentivizing early payments.
- Implementing inventory reorder alerts to avoid overstocking.
Healthy working capital cycles keep asset turnover ratios high by ensuring that assets continuously support sales.
Dispose/lease/partner on underused assets
Disposing, leasing, or partnering on idle equipment can immediately improve the fixed asset turnover ratio. For example, warehousing leases for unoccupied space or maintenance site leasing leads to a lower asset load while keeping the level of service the same.
Maximize efficiency, minimize waste. Explore tools designed for growing businesses.
Explore nowAsset Turnover and Cash Flows
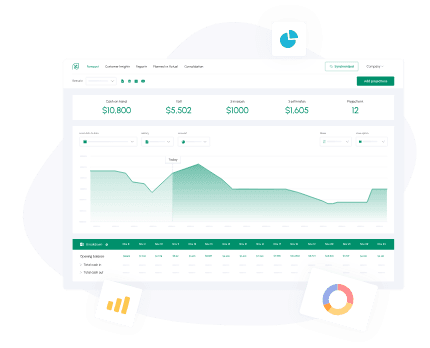
Photo: Cash Flow Frog dashboard showing real-time cash flow forecasting
Efficient asset management improves liquidity and reduces financing pressure. Understanding how to calculate asset turnover helps finance teams connect efficiency metrics to real cash outcomes. Businesses that turn assets more quickly typically generate faster inflows.
For instance, if a company shortens production and delivery cycles, it can accelerate cash collection and reduce reliance on credit lines, thereby improving liquidity. Integrating cash flow forecasting demonstrates the impact of minute changes in ratios on the short-term liquidity and long-term resilience.
Even small improvements can ease borrowing needs and increase reinvestment capacity. Forecasting models then tie operational performance directly to financial sustainability, ensuring steady cash cycles even during slower sales periods.
Modeling Asset Turnover in Forecasts
Financial planners often pair the asset turnover ratio with sales forecasts to see how efficiently a company can grow. A slight increase in turnover can compensate for slower sales and reveal unused capacity inherent in existing operations, whereas a declining trend can signal unused capacity or outdated infrastructure.
Operational scenarios can be run by integrating turnover metrics into forecasting models. With this, planners can test the impact of an operation and determine the financial implications of every decision. Done this way, decision-makers have a realistic view of how resource management impacts long-term profitability.
Limitations You Shouldn’t Ignore

Photo: Evaluating qualitative factors that asset turnover ratios can’t capture - Freepik
The asset turnover ratio provides strong quantitative insight but doesn’t account for qualitative aspects that often shape real-world performance. Some of these factors are outlined below:
| Factor Not Measured | Why It Matters |
|---|---|
| Management effectiveness | Determines how efficiently assets are deployed and maintained |
| Brand strength | Affects pricing power, sales stability, and customer preference |
| Customer loyalty | Supports consistent revenue and long-term cash inflows |
Because of these limitations, the ratio should always be used in conjunction with other complementary metrics such as profit margins, leverage, and market position. Industry context will also play a role; the ratio for a manufacturing firm will differ from that for a retailer or service-based firm.
Real-World Uses: Lenders, Investors, Operators
Different stakeholders interpret the asset turnover ratio differently, depending on their objectives.
- Lenders use the ratio to evaluate repayment reliability and asset productivity. A higher turnover reassures creditors that resources are generating sufficient cash to cover obligations.
- Investors study efficiency trends to assess management discipline and determine whether new funding will drive real growth or simply expand the balance sheet.
- Operators rely on the ratio as a management control tool. They use it to identify underused assets, adjust production schedules, and decide when to replace or lease equipment.
A persistent ratio that indicates that the capital is being used effectively to generate returns. A persistent decline, in contrast, may represent overcapacity or a loss of operational momentum and may require corrective action.
Across all roles, the ratio acts as a shared efficiency language. It allows stakeholders to objectively compare performance, align operational and financial strategies, and set measurable targets for sustainable asset productivity.
Make Assets Earn Their Keep
When you pair asset tracking with reliable cash flow software, you make sure every resource truly earns its place. Monitoring utilization data alongside your fixed asset turnover ratio helps you uncover hidden capacity and turn dormant assets into profit.
Maintaining a strong asset turnover ratio converts passive assets into reliable revenue streams and promotes long-term financial discipline through data-driven decision-making.
Take full control of your cash flow today. Sign up for Cash Flow Frog.
Sign up todayRelated Terms
FAQ
Looking for more help?
Visit our help center to find answers to your questions about CashFlowFrog.
Trusted by thousands of business owners
Start Free Trial Now