New tooltips help you see your balances at any point on the graphs
We’ve added new tooltips to the cash flow graphs and charts to help you see the exact amounts at any point in time. This is an essential feature of any cash flow graph.
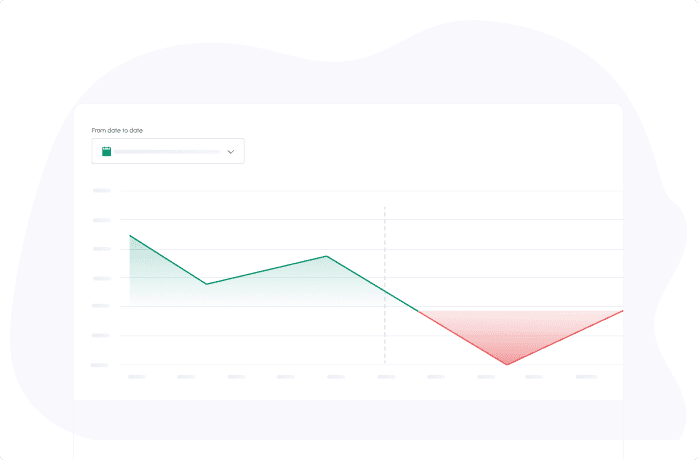
Every graph has a slightly different tooltip. The tooltip in the Cash Balance graph shows the actual/expected cash balance on the specific date you’re pointing to:
The tooltip in the Monthly graph shows the actual/expected cash-in, cash-out, monthly total and cash balance amounts:
The tooltip in the Cash in/out pie charts shows the total amount per type, during the time period you have selected:

How to Calculate Free Cash Flow (FCF): Formulas + Real Examples
Read more

The 3 Types of Cash Flow: What They Mean and Why They Matter
Read more

Cash Flow Forecasting Template
Read more

Your Guide To Financial Metrics And KPIs
Read more

10 Cash Management Trends for 2026
Read more

10 Best Cash Flow Business Ideas: Build Income That Counts
Read more
FAQ
Trusted by thousands of business owners
Start Free Trial Now