Leveraging Excel Integration for Enhanced Financial Insights
Forecasting in Excel was the de facto for many companies, but as computing power has increased, we’ve seen more companies use AI and cloud-based tools to improve their financial insights.
The Power of Excel: A Fundamental Tool for Financial Data Analysis
If you want to use Excel and a tool like Cash Flow Frog, you can combine them for a powerful look into your company’s finances. First, you’ll want to get started with integrating Excel into Cash Flow Frog.
Getting Started with Excel Integration
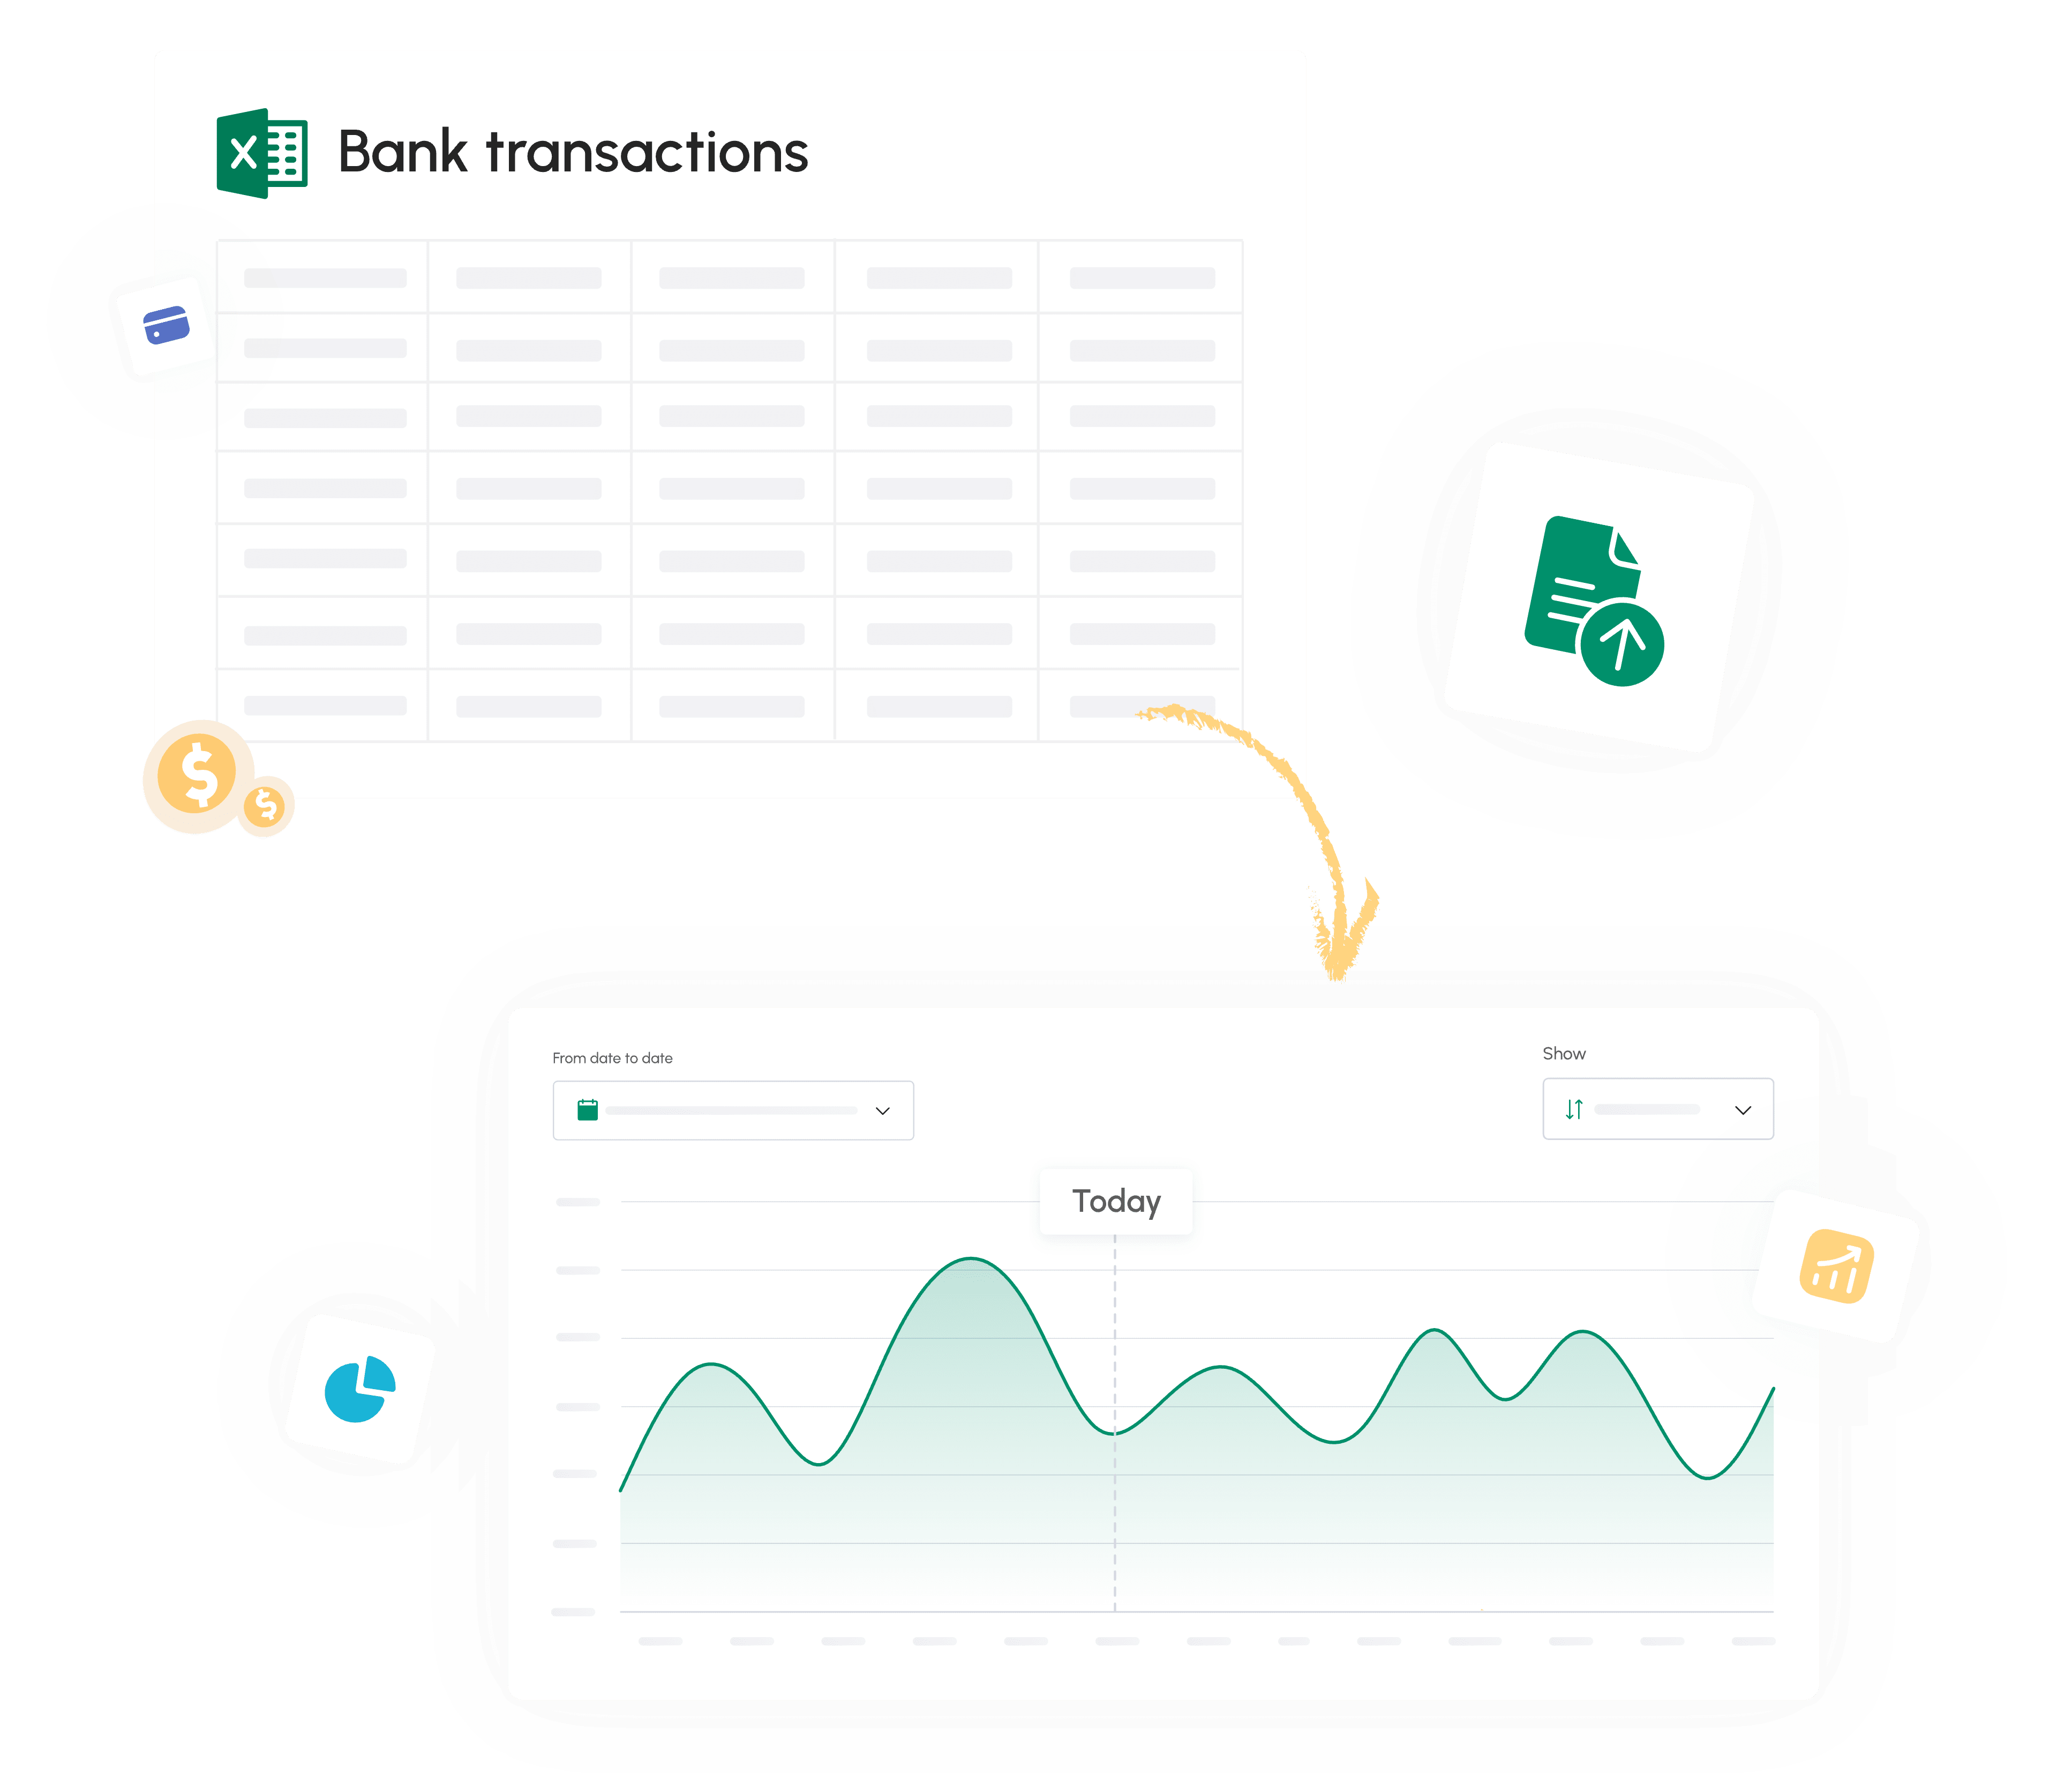
We've made it fast and easy to import a spreadsheet instead of running a forecast in Excel. You can begin integrating your data in a few steps:
- Log into your account.
- On the homepage, find and click on Import Transactions.
- Download the Excel template we provide.
- Fill in the template with your data.
- Save the file.
- Upload the finished file to your Cash Flow Frog account.
You've now integrated your Excel forecast sheet into your account so that you can use the data you input to better understand your cash flow.
Importing Financial Data into Excel
We make it easy for you to download the data that you have on our platform and import it into Excel. In fact, you can log into your account and find the “Export” icon. Click the icon and you’ll be able to Export Excel Report.
You can download your forecasts and projections right into Excel or just download your basic cash flow report.
Excel Formulas and Functions for Financial Forecasting
Do you know how to forecast in Excel? If not, you need to use formulas that will be used to run the forecast. You can also import your data into a tool like ours to run the forecast.
Mastering Excel Formulas for Precise Predictions
Excel has so many formulas that you can add to create your own powerful spreadsheet. If you don’t know how to use forecast in Excel, you can use the following basic function:
- =FORECAST(x, y,z)
What does this mean?
- X = your new value
- Y = a range of data or an array
- Z = an array of data
You can view real-world examples of this function here.
Projections can also be run using the same formula. Once you know how to forecast revenue in Excel, you can then focus on improving accuracy. Microsoft offers a detailed tutorial (read it here) that you can use to create great forecasts.
You can also do fun things, like creating graphs and charts, which will allow you to visualize the data.
Automating Financial Analysis with Excel Functions
Forecasting in Excel is one thing, but you can also run financial analysis. A few features that allow you to do this within Excel are:
- Macros
- PivotTable
However, you’ll need to have a complete Excel with all of your financial data in it, such as:
- Revenue
- Gross margin
- Operating income
- Income before income taxes
- Net income
Pivot Tables are the real function that you’ll need to master because they allow you to sort your data and make sense of it. Summarizing your large data points, discovering trends and patterns is possible with one of these tables when they’re not with normal tables.
However, using one of these tables requires a lot of patience and understanding of PivotTables.
Microsoft Support offers a video tutorial that shows you the ins and outs of using one of these tables to better understand your financial reports. You can watch the video and learn how to perform these functions on your own.
Visualizing Financial Trends with Excel Charts
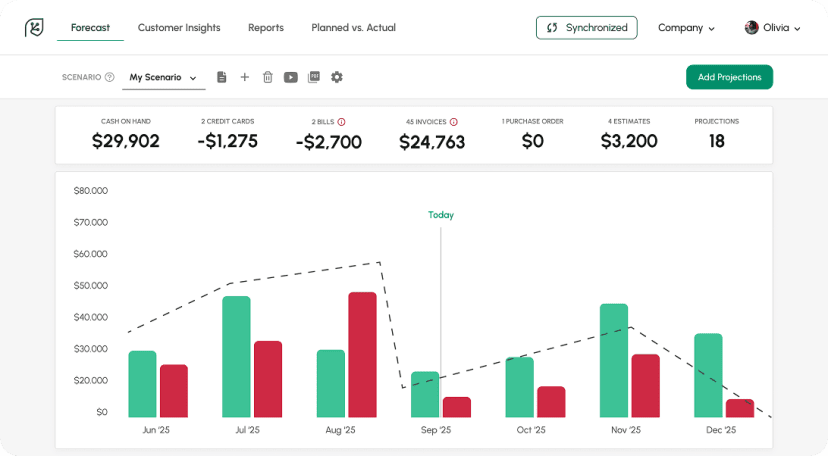
Data on a page is confusing and overwhelming when it’s all figures. Your business may have tens of thousands of entries on an Excel spreadsheet. However, you can compact this vast data into easy-to-visualize information on charts and graphs.
Imagine viewing your revenue over a 12-month period with 10,000 entries or looking at a graph that shows you:
- Month-by-month growth
- Revenue totals by month
- Etc.
Excel’s dynamic charts can help you better understand your data. Let’s see how.
Creating Dynamic Financial Charts in Excel
WallStreetMojo offers dynamic charts that update when the data range of the chart is updated. If you setup your file properly, you can have a spreadsheet with highly accurate information that uses:
- OFFSET function
- Excel tables
If you follow the tutorial from the link above, you’ll be able to create a dynamic spreadsheet that adapts to your data as it changes.
Interpreting Data Trends Through Excel Visualizations
Every chart and graph will be different, but you can help people interpret it with a small label. For example, if you have a graph with blue, green and red colors, you can have labels that show:
- Blue block meaning salary
- Green showing raise expectations
- Red showing bonuses
Best Practices for Excel-Based Financial Data Forecasting
If you have Excel and want to use it for financial data forecasting, you should consider the following best practices:
Ensuring Data Accuracy and Consistency in Excel
A major risk of Excel data is that you risk data becoming inaccurate and inconsistent. You may miss a single zero and create forecasts that are all inherently inaccurate until you find the error.
So, what can you do?
Importing your data from your accounting software is one of the best options. You can import data to ensure that it’s the same as the source. Many accountants opt to use SaaS or cloud-based accounting solutions that connect to your:
- Database of sales
- Bank accounts
- Payment processor
- Etc.
Reviewing your data to ensure that it’s accurate and error-free is a must. Accounting teams will often have one person input the data and one or more people verify the information that you input.
Collaborative Financial Analysis with Excel Integration
Excel integration can also be collaborative. You'll find cloud versions of Microsoft Excel or competing products, such as Google Sheets. You can connect multiple accounts, all of which can collaborate on the same file at the same time.
Excel Integration Tips for Financial Success
Forecasting in Excel is limited to advanced formulas. Instead, you can:
- Integrate your Excel sheet into Cash Flow Frog
- Run advanced calculations and reports
- Export the results back to Excel
Integrating your sheet with any third-party tool will require you to follow the template precisely. If you do not have your data setup properly, it may lead to import errors or import failure.
Even if the data is imported correctly, there is the risk of error if you don’t have your Excel setup properly.
Conclusion
Excel is still one of the best spreadsheet solutions on the market going into 2024. You can use Excel to help you better visualize your financials using charts, diagrams and even third-party tools.
If you want to try Cash Flow Frog + Excel, sign up to start for free.
New: Setting threshold
Read more

5 Key Financial Metrics Every Business Owner Should Track
Read more

What Is Profitability Analysis and How to Do It?
Read more

Best QuickBooks Online apps
Read more
How To Calculate Adjusted EBITDA and Why Is It So Important?
Read more

Best cash flow forecasting software
Read more
Trusted by thousands of business owners
Start Free Trial Now