Financial Reporting and Analysis: The Key to Corporate Success

Analytics reporting differs from traditional reporting because it involves further analysis of the data available. At the root of the word is “analysis,” which is an indication that businesses dig into the data that they have available to:
- Interpret
- Understand
- Report
For example, you may have a report indicating that you have 1,000 new customers who are now regularly purchasing your products. While this information gives you peace of mind that your business is growing, it’s missing the substance that you need to understand what led to the growth.
Reporting analysis will help you understand:
- What marketing channels drove leads
- What products the leads are buying
You can dive deeper into your business’s data to have a firm understanding of your underlying operations when using data analysis.
We're going to explore reporting and analysis to better help you understand why you need both to find success in your business.
The Importance of Reporting and Analysis in Modern Business
Before we go any further, it’s important to answer two main questions:
What is Financial Analysis?
The financial analysis definition that most people follow is: an assessment of evaluation of multiple parts of a business that determine suitability and performance. For example, you’ll analyze:
- Stability
- Profitability
- Viability
- Etc.
You may even conduct a financial analysis on the profitability of a major project proposal to understand whether it’s an opportunity worth pursuing. Analysis at its foundation will dig into the data that you have to come to a conclusion on something financial-related.
What is Financial Reporting?
Financial reporting is an integral part of running a business because it helps you stay on track to meet your goals. Reports will vary based on the type created, but in general, they are disclosures of your financial data over a specific period of time.
Reports give an overhead view of how a business is operating and may be used for:
- Decision-making
- Securing investments
- Other core tasks
An analysis is an in-depth view of the financial data of a business, while reporting shows the overall financial health of the company in much less detail.
Why Reporting and Analysis Matter
Reporting and analysis matter because if you don’t have a firm grasp of your business’s finances, it’s possible to be one of the 50% of companies that fail within the first five years of operations.
Analysis and reporting matter because they:
- Help business stakeholders make informed decisions
- Identify where you’re spending too much money
- Increase the business’s odds of success
- Reduce the risk of fraud
- So much more
We're going to focus on decision-making because if you’re making poor decisions, it will negatively affect your company’s chance of success.
How Reporting and Analysis Drive Informed Decision-Making
Financial reporting and analysis, when used in the world’s largest businesses, are all about decisions. If you’re making decisions based on assumptions, a lot can go wrong in your operations that wouldn’t have happened if you had the data in front of you.
For example, if you analyze the data and your recent cash flow report, you can determine:
- Capital available to hire a new employee
- Risks of running out of cash flow
If you see that your business’s net revenue is up 20%, you may falsely assume that you can afford to expand to a new office because you only have one piece of the puzzle. Instead, if you look deeper, you may find that expenses are up 30% because:
- Product costs are higher
- You hired a new employee
- Fees are up from vendors
Reporting and analysis are meant to help drive the decision-making process so that you make the right choices at the right time.
The Connection Between Reporting and Business Success
Analysis reports are a major part of investor and stakeholder meetings. You may have to review tons of reports:
- Balance sheet
- ncome statement
- Statement of cash flows
- Equity statements
- Financial statements
Your financial reports will show the financial condition and health of the business. If you analyze all of this data, you have the opportunity to find ways to operate a LEAN business that reduces unwanted expenses, maximizes profits and does it efficiently.
If your reports show that you’re not being paid on time, it may mean integrating an automated invoicing system that reminds clients to pay you to keep cash flow high. During periods when the business struggles to maintain cash flow, you can take strategic steps to secure more funding.
One of the most important reports that stakeholders will analyze is your cash flow reports.
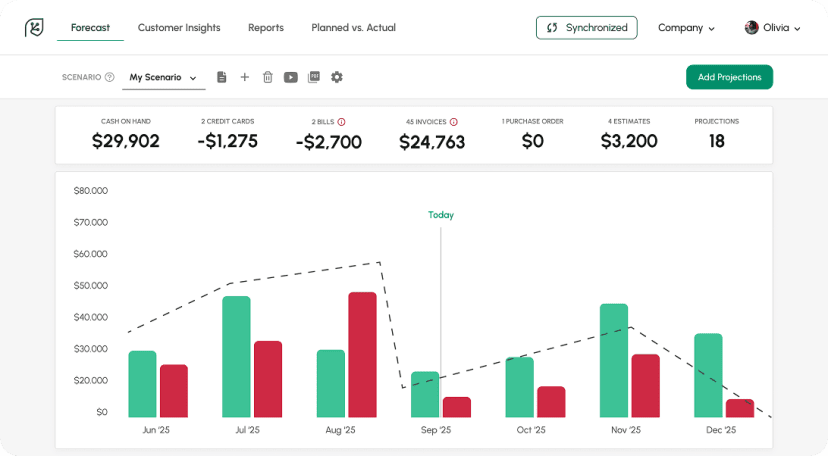
Utilizing Cash Flow Forecasting Software for Strategic Decision-Making
Financial and analytics reporting can be automated, to a degree, to help you improve your strategic decision-making. In the past, you would need to work with a team of accountants who would enter all of your cash inflows and outflows to run a cash flow forecast.
Weeks of work would be needed to run forecasts for larger entities, often leaving a gap in decision-making.
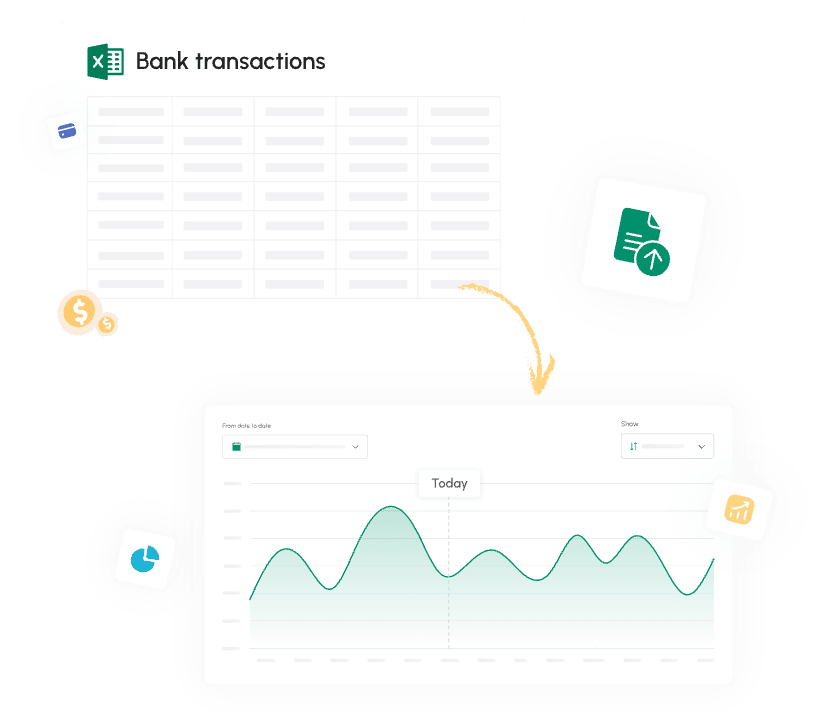
Tools like Cash Flow Frog help by:
- Connecting to bank accounts
- Connecting to credit card accounts
What once took weeks to perform now takes minutes with some platforms.
What is Cash Flow Forecasting Software?
A major difference between reporting vs analytics is that analytics provides in-depth data that you can dissect to better understand the financial health of your operations. Cash flow forecasting software can exist in either:
- Standalone software
- Software-as-a-software
Software may offer offline, online and even app functions, but they’re all very similar. These software options will crunch the numbers for you, connect to your important financial accounts and allow you to run forecasts and reports fast.
If you have an in-house accountant and are a smaller business, you may not need to use software. But if you opt to use software for your cash flow reports, they’ll offer your business many benefits that save you time and money while helping you make smarter operational decisions.
Benefits of Cash Flow Forecasting Software
Software can help you take advantage of the benefits of cash flow forecasting without the added time and effort that comes with manual methods, such as spreadsheets.
There are many advantages to using software over spreadsheets for your forecasting needs. These include:
- Saved time. The most obvious benefit of using software is the time savings. Manual data entry and calculations are time-consuming and prone to errors. Software automates the process to save time and minimize the risk of errors.
- Improved accuracy. Cash flow software connects with your bank account, accounting software and other financial data sources. This ensures that the data you use to build your forecasts is reliable and accurate.
- Easy integration. With the right tool, you can easily incorporate your forecasts into your analysis reports and other solutions in your tech stack.
- Improved decision-making and planning. Software helps you visualize your cash flow, allowing you to make more informed decisions and smarter strategic plans. You can even use software to test out various scenarios and see how it will impact your cash flow.
These are just a few of the many benefits of using cash flow forecasting software for your financial reporting and analysis.
Integrating Cash Flow Forecasting into Reporting and Analysis
Cash flow forecasting can give your business a clearer picture of its financial health. It can help you determine whether you’ll have the funds to hire in the next month or if you need to take proactive measures now to prevent a cash shortage in the future.
Because cash flow plays such an integral role in the success of every business, it’s important to integrate your forecasts into your financial analysis report. With a tool like Cash Flow Frog, you can easily generate customized branded reports that communicate key insights to stakeholders. These insights can be used to support decision-making.
Best Practices for Effective Reporting and Analysis
Reporting and analysis can play a crucial role in your success, but only if done properly. Inaccuracies and improper analysis can steer your organization in the wrong direction.
Let’s look at some of the best practices for effective reporting and analysis.
Data Collection and Management
Data is the backbone of effective reporting and analysis. But you can’t just use any data. It must be accurate and up to date.
To ensure your data is viable, you must implement proper data collection processes and a framework for managing your data.
Depending on the size of your organization, you may have a variety of data sources, including budgeting tools, accounting systems, spreadsheets and project management software.
It can be challenging to manage all of these data sources without technology.
If possible, data collection and entry should be automated and maintained on a centralized platform. Financial management software can help with this process. Along with saving time, automating data collection will also greatly reduce the risk of errors.
Regardless of which method you use for data collection and management, it’s important to ensure that you document your collection process. Documentation will allow for:
- Consistency to ensure your data is always reliable
- Regular reviews and audits to improve your processes over time
Documented processes can also be shared with stakeholders to give them more insight into the data used to generate reports and how it’s used.
Key Performance Indicators (KPIs) for Reporting
Along with having a documented process for data collection and management, it’s also essential to identify your KPIs for analysis reports.
The KPIs you track in your reports will depend on your goals and unique business model.
However, there are some metrics that every business should be monitoring, including:
- Net profit margin
- Gross profit margin
- Revenue growth rate
- Working capital
- Operating cash flow
- The lifetime value of a customer
- Inventory turnover
- Cash conversion cycle
These are just a few of the many KPIs you may want to track in your reporting and analysis. It’s vital to ensure that you’re tracking the metrics that make the most sense for your business and will help you determine whether you’re on track to reaching your financial goals.
Reporting Tools and Software Solutions
Generating a financial analysis report can be a time-consuming process without the right tools and software.
Automated tools and software will simplify report generation by saving time and reducing the risk of human error.
When choosing your tools and software, ask yourself:
- Is this platform easy to use? If there’s a steep learning curve, it may be challenging to implement it into your workflow.
- Does it integrate into our tech stack? Ideally, your reporting tools and software should pull financial data from your accounting software to simplify the process and improve accuracy.
- Does it offer all of the features I need? It’s important to choose solutions that will help you achieve your goals.
In many cases, reporting tools and software offer free demos or trials that you can use to determine whether it will be a fitting solution for your organization.
Understanding and following the best practices for reporting and analysis is important, but looking ahead to the future can also help you prepare for changes that may lie ahead.
Future Trends in Reporting and Analysis
Report analysis will continue to evolve and change as technology and the economy evolves. While there are many future trends to be on the lookout for, these are some of the most prominent.
AI and Automation in Reporting
One trend that is sure to transform the landscape of report analysis is AI and automation. Both AI and automation have the power to:
- Generate reports more quickly
- Significantly reduce the risk of error
- Analyze data in minutes and compile insights to support decision-making
Creating reports using manual methods is outdated and time-intensive. AI and automation will continue to improve and help organizations develop more robust reports quickly.
The Evolving Role of Reporting in Corporate Strategy
Reporting will continue to play an important role in corporate strategy simply because data helps leaders make more informed decisions.
As AI and automation continue to improve reports and offer more insights, reports will become more integral to corporate strategy and help businesses achieve their objectives.
Conclusion
Financial and analytics reporting is the key to corporate success. Financial reports help businesses understand their financial position, and analysis provides further insight into how things can be improved. Harnessing the power of analysis and reporting – along with cash flow forecasting software – will help you stay on track to achieving your goals.
New: Setting threshold
Read more

5 Key Financial Metrics Every Business Owner Should Track
Read more
What Is Profitability Analysis and How to Do It?
Read more
Best QuickBooks Online apps
Read more
How To Calculate Adjusted EBITDA and Why Is It So Important?
Read more

Best cash flow forecasting software
Read more
Trusted by thousands of business owners
Start Free Trial Now