Actuals Vs. Budget: A Guide to Budget Variance Analysis

Actuals vs budget variance are crucial for businesses because budgets are forecasts, allowing you to “predict” for expenses that can change throughout the year. On the outside, a budget and actual are two sets of data.
However, you need to learn how to analyze the data presented and make the most use of it.
In this guide, we’re going to help you understand how to calculate budget vs actual variance percentage, why this type of calculation matters and how to strategize your finances based on these figures.
What Is Budget Vs. Actuals Analysis?
Budget vs actual is simply:
- Gathering your budget data
- Gathering your “actual data”
- Analyzing the two
Of course, there is a lot more that goes into your analysis, but this is the basic definition of what takes place. Financial leaders in your business should compare the difference between budget and forecast and then look at why the variance occurs.
Often, the budget you plan for the period will be different than the actual expenses.
Why Should You Assess the Variances Between Your Budgets Vs. Actuals?
If you analyze budget analysis examples, it becomes clear that there’s a variance between actuals and your budget. For example, perhaps you budget $10,000 for marketing but spend $12,000. This means that there’s a $2,000 variance.
Financial leaders in your business will assess the $2,000 variance in the budget vs actual to:
- Understand why the variance occurred
- Learn about changes in operation conditions
- Better forecast expenses in the future
The variance may have been because the business grew faster than expected, requiring more marketing to push products or that inflation led to a 20% increase in prices.
However, budget and actual data will also include revenue.
We’ll be covering the types of variances that exist further down in this guide. These types of variances fall into two main categories, and while polar opposites, they’re very important because they provide your team with a better understanding of your operations.
5 Factors that Cause the Variance
Your budget is essential for financial planning, but even the most carefully thought-out budget can disconnect from reality. Here are the most common reasons that affect your actual spend vs budget:
1. Market Shifts
Market changes like the weather—from inflation to supply chain issues and fluctuating interest rates- can impact your numbers significantly, leading to overspending or less revenue.
2. Unplanned Expenses
Budgets can get surprises, whether it's emergency repairs, legal fees, or unexpected compliance costs. These unplanned expenses quickly increase your actual values, creating the variance.
3. Operational Inefficiencies
Delays and inefficiencies not only make your process longer but also drive up your costs. As they overrun your timeline and use more resources, they continuously break your budget, leaving you to overspend.
4. Seasonal Fluctuations
Industries often experience seasonal highs and lows. Without accounting for these cycles, you may overspend during slow periods or underestimate costs during peak times.
5. Changes in Workforce or Staffing Needs
Hiring temporary staff to cover overtime during busy periods or dealing with turnover, can lead to unexpected variances in labor costs, impacting your budget.
Many industries experience natural ups and downs. If your budget doesn’t account for these cycles, you might find yourself spending more (or earning less) than expected during slower periods. Using cash flow software for small businesses can help track these fluctuations more effectively, ensuring your budget can be adjusted more effectively.
Budget Vs. Actual Variance Formula
The budget vs actual variance formula is simple:
- Variance = (actual - budget)
We’ll explore a few ways that you can present this data in a more meaningful way, but the main thing to know is that you’re simply looking for the difference between the two data points. Subtraction is the way to find these differences, which can be positive or negative.
You can even create your own budget vs actual variance analysis template based on your business’ data to reuse in the future.
Performing A Budget Vs. Actual Variance Analysis
If you want to perform your own variance analysis, you can follow these six steps to get started:
1. Identify the Forecasted Amount
Before you can run an actual vs budget analysis, you need to:
- Gather your budgeted data
- Gather all of your actual expenses
You can use your cash flow statements to determine the variance between actual and budget, or you can use your balance sheets. It's important to gather all of the actual data that you can, including:
- Gross profit
- Net income
- Cost of goods sold
- EBITDA
Budget data should be available already, and this is what you’ll compare to your actual data in your analysis.
2. Determine the Actual Amount
Variance analysis in budgeting requires that you gather data for a specific period of time. For example, most businesses perform analysis on the following basis:
- Monthly
- Quarterly
- Annually
Performing analysis on all of these periods will allow you to have a better understanding of what transpired throughout the year that caused a variance.
You need to be sure to adjust your budget after performing an analysis to get the most out of your data. If you fail to make adjustments, the data is far less valuable. We'll be discussing updating your forecasts in the last point in this list for added clarity.
3. Calculate the Variance
Once you have completed the first two steps, it’s time to learn how to calculate the variance between budget and actual. You can do this in one of two ways:
- Percentage
- Dollar value
Here’s how to create a variance percentage formula for actual vs budget:
((actual/budget)-1) 100.*
For an easier explanation, let’s look at a real-life budget analysis example:
- Actual earnings of $500,000
- Projected earnings of $475,000
In this case, ($500,000/$475,000) = 1.0526. Then, we subtract 1 to have 0.0526 and multiply this by 100 to have a percentage variance of 5.26%.
Based on this period data, your percent variance was 5.26% above expectations.
However, you may also want to perform a dollar variance, which is easy to do. The dollar variance formula is (actual – budget), or in the example above, (actual/projected). For example:
- $500,000 - $475,000 = $25,000
- Dollar variance = $25,000
You can use percent or dollar variance in your report, and many companies use both.
4. Derive Results
You’ve determined the budget for the actual report, and now the finance team needs to crunch the numbers. Whether the variance is positive or negative, it’s important to dive deeper into the financials to understand why the figures do not match.
For example, perhaps the actual earnings are $25,000 higher due to:
- Certain marketing campaigns that brought in more revenue
- Local growth, leading to more customers
- Higher prices
It's important to really dissect the data to know why there’s a variance and how this information can help you in future financial planning.
5. Create Management Reports
It's important to know how to present budget vs actual report in a way that management can easily review. While you can provide just the final numbers, it’s best to categorize the variance down further, such as:
- Fixed costs
- Manufacturing costs
- Material costs
- Labor costs
You can tally all of the costs for these categories for your actual and budget data and then calculate the variance for each. Managers, owners, investors and the like will want to view all of the outcomes in a way that is easiest to review.
For example, if you have total expense variances of $20,000, the team would like to see:
- $1,000 in fixed-cost changes
- $8,000 in manufacturing cost changes
- $7,000 in material cost changes
- $4,000 in labor cost changes
Knowing how to compare budget vs actual can demonstrate the reasons behind the variances. This helps everyone better understand the business’s performance and supports future decision-making.
6. Update Forecasts
The actual budget variance may require forecasts to be updated. For example, if you run these calculations in Q2 of the year, you may want to update the forecast for the rest of the year. The update will provide a clear reflection of the changes that happened throughout the comparison period.
Updating forecasts will allow you and your managers to have a better understanding of the business’s operations.
If you notice a major variance in revenue and sales, you may decide that it’s time to open a new office or even expand into new markets because market conditions are in our favor.
What Types of Variances in A Budget Vs. Actuals Report Can You Analyze?
Budget vs actuals has two main types of variances and a bunch of categories that you need to know about.
Favorable Variances
A favorable variance is always a good thing. If your business does better than expected, it’s always a good thing. For example, you may have forecasted that your business revenue would be $200,000, but at the end of the period, you may have made $300,000.
In this case, you have a $100,000 variance. You may also have projected $10,000 in advertising expenses but spent only $5,000. In this case, the favorable variance is $5,000.
It's still important for you to analyze all of your data to learn:
- Why the business’s revenue grew
- Why the business’s advertising expenses are less expensive
However, there’s also a chance of having an unfavorable variance, too.
Unfavorable Variance
An unfavorable variance is the opposite of a favorable variance. Perhaps you expected to have $10,000 in expenses, but this figure rose to $15,000. You may have also expected revenue to be $200,000, but due to an increase in competition, you had $150,000 in revenue instead.
In the case of revenue, you had a -$50,000 variance.
However, you can also break your variances down further into the following types:
Revenue Variance
The difference between your projected and actual revenue. Revenue has multiple variables that can impact it, but many of these are outside of a business’s control. Perhaps customer demand fell due to economic concerns.
Unfortunately, there’s little that your business can do to change economic concerns.
However, expenses can be broken down into categories, which you can then analyze on their own to better understand what your business is spending money on.
Expenses Variance
The difference between your categorized budgeted expenses for the year and what these expenses came out to by the end of the period. Accounting teams spend a lot of time on expenses so that they can find areas to save the business money.
Often, expenses are broken down into multiple types so that the company can see where the variances are occurring.
The four expense types that are used most often include:
- Fixed costs. Your fixed costs are what you need to pay for every month to operate, such as loan payments, utilities and other expenses. These costs do not change as you earn more revenue.
- Labor: Costs for labor may increase due to workers working overtime or expanding your business. However, financial teams can also help lower labor costs by outsourcing work, streamlining operations and using other strategies.
- Materials: Expenses to create the goods or services you provide. You have some control over material costs, but since a third party is involved, you will never have full control of your material costs. However, there may be some strategies that you can use to lower these costs, too.
- Manufacturing: Finally, your manufacturing costs often remain similar and can also include things such as the depreciation of equipment, too.
When financial leaders compare the budgeted and actual expenses, they can learn exciting information, such as ways to lower costs or material costs that are rising and product costs that need to increase.
Use Budget Vs. Actuals Variance Analysis to Improve Strategic Finance
You have the difference between budget and actual figures outlined, but now what? There's still a lot to do. Data is only useful if you use it in a way that improves the business. You may want to use the analysis data to:
- Make better decisions. Perhaps your business finds that the projected vs actual revenue is far off. In this case, you dig into the data further and find that your profit margins are now 10% lower than they were when the projection was made. Rising material costs may have been overlooked, and now you can justify increasing the price of the product to improve revenue.
- Market your product better. If revenue falls due to slumping sales, you may find that the sales drop is due to a reduction in overall advertising. The correlation between advertising and lower sales may mean it’s time to increase your advertising budget going forward to boost sales.
- Reduce risk. Sometimes, the variance shows a sharp drop in revenue and an uptick in expenses. You can use this information to find ways to reduce expenses, even if this means having to lay off some of your workforce to tame your business risk.
- Find ways to lower costs. Material costs are a part of doing business, but when you analyze your actuals, you may find that costs are rising. Perhaps the supplier is charging more than before, but you’re also manufacturing more goods. You may use this data to negotiate better terms with your suppliers, which will lower your overall expenses.
However, there is another, often overlooked way to use this data: locate hidden issues in the business.
Monthly and quarterly variance reports generated by financial forecasting software are important to run because they provide insights before a small problem becomes a major business dilemma. A good example of this is that the market demand for your main product may have dried up.
If you still dedicate 50% of your advertising budget to this specific product, you may find that your revenue falls dramatically.
Why?
No one is buying the product. Demand no longer exists. If you allow this peril to exist, it can lead to you spending more advertising dollars on products that will not make you money. In the long term, it would be better to revise your budget and reallocate the marketing dollars to another product or service that is in high demand.
You may also find that your revenue isn’t high enough to sustain your business, causing you to increase your fixed costs via loans.
In this case, loans are used to supplement cash flow and ensure that you can still make payroll and satisfy your debts. If you notice this trend where revenue is lower than profits, it may mean it’s time to lay off staff, close offices or take out a loan before it’s too late and your business ends up going bankrupt.
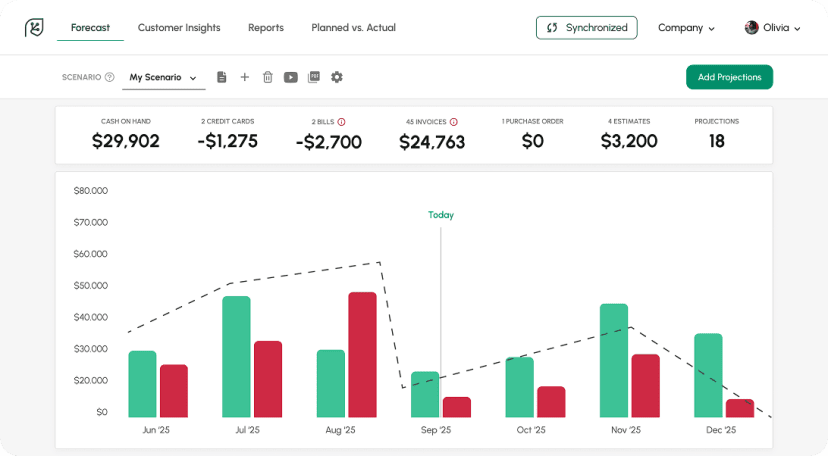
Knowing the variance formula for budget vs actual will help your business make smarter business decisions. If you want an easier way to compare this data, you can try our planned vs actual feature for yourself. Why crunch the numbers manually when Cash Flow Frog can do it for you in seconds?
New: Setting threshold
Read more

5 Key Financial Metrics Every Business Owner Should Track
Read more

What Is Profitability Analysis and How to Do It?
Read more

Best QuickBooks Online apps
Read more

How To Calculate Adjusted EBITDA and Why Is It So Important?
Read more

Best cash flow forecasting software
Read more
Trusted by thousands of business owners
Start Free Trial Now